
Image
|
Figure Caption
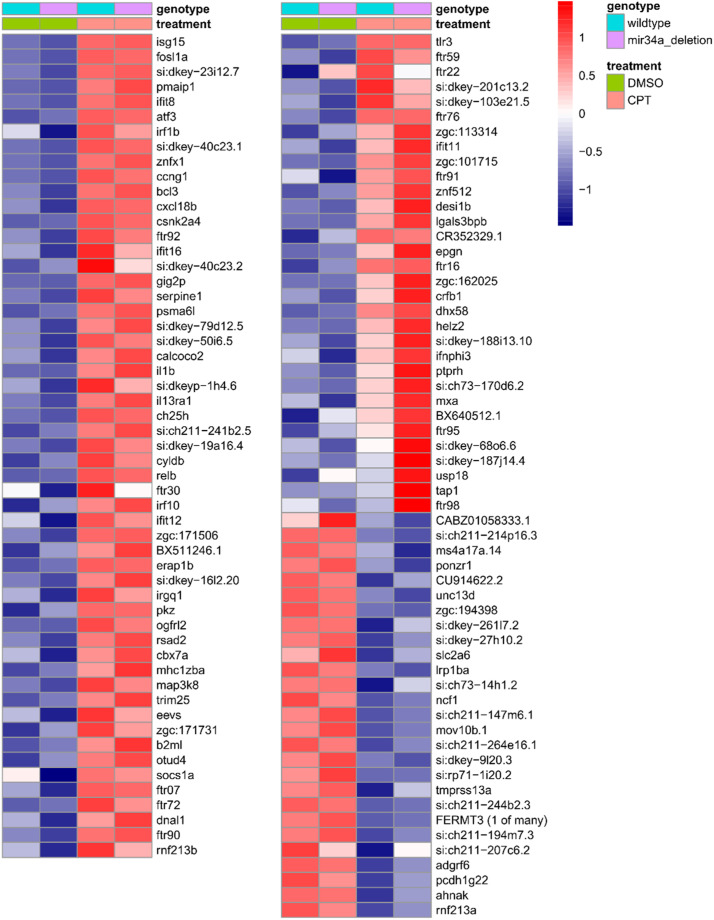
Fig. 3
Heatmap of expression values for interferon-regulated genes (IRG) induced or repressed by DNA damage due to camptothecin treatment. Heatmap of normalized variance-stabilized gene expression values for known IRGs. To simplify presentation, averages of 3 biological replicates belonging to each treatment group are shown in the heatmap. Both up and down-regulated IRGs sorted in descending order by fold change are shown in the heatmap. The values were scaled row-wise. Treatment and genotype assignments are indicated by color bars above the heatmap, and the legend is provided at the top right.
Acknowledgments
This image is the copyrighted work of the attributed author or publisher, and
ZFIN has permission only to display this image to its users.
Additional permissions should be obtained from the applicable author or publisher of the image.
Full text @ Data Brief