- Title
-
Thymosin β4 promotes zebrafish Mauthner axon regeneration by facilitating actin polymerization through binding to G-actin
- Authors
- Song, Z., Han, A., Hu, B.
- Source
- Full text @ BMC Biol.
|
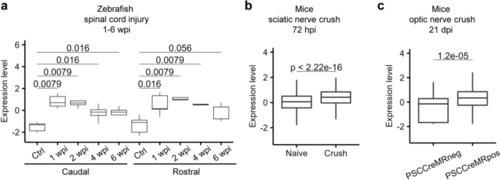
Tβ4 is upregulated after axonal injury in both zebrafish and mice. a Expression profile of tmsb4x in the adult zebrafish spinal cord after injury. wpi, weeks post injury. Each group contains 5 samples, except for the 6 wpi caudal group, which contains 4 samples. b Expression profile of the Tmsb4x gene in DRG neurons at 72 h after sciatic nerve crush in mice, as determined by snRNA-seq analysis. "Naive" represents the group without crush injury, whereas "crush" represents the group that underwent crush injury. Cell numbers: Control, 6141; Crush, 5172. c Expression profile of Tmsb4x in RGCs with successful and failed axon regeneration following PTEN knockout, SOCS3 knockout, and CNTF overexpression. In this study, the authors used dextran micro-Ruby (MR) to retrogradely label RGCs with successful axon regeneration. "PSCCreMRneg" represents RGCs with failed axon regeneration and negative labeling of MR, while "PSCCreMRpos" represents RGCs with successful axon regeneration and positive labeling. Cell numbers: PSCCreMRneg, 66; PSCCreMRpos, 179 |
|
Knockout of tmsb4x attenuates axon regeneration of Mauthner cells. a Experimental workflow diagram. b A representative image of an injured Mauthner axon. The arrow indicates the injury site, which above the cloacal pore. Scale bar, 50 μm. c Representative images of Mauthner cell axon regeneration in the tmsb4x+/+, tmsb4x+/- and tmsb4−/− lines at 48 hpi. Asterisks indicate the sites of axon injury, and arrows indicate the regenerated axon terminals. Scale bar, 100 μm d and e Statistical graphs of the length (d) and branch number (e) of regenerated axons in the tmsb4x+/+, tmsb4x+/- and tmsb4−/− lines (lengths: tmsb4x+/+, 402.5 ± 39.5 μm, n = 14; tmsb4x+/-, 278.6 ± 26.9 μm, n = 26; tmsb4x−/−, 246.1 ± 26.8 μm, n = 18; branch numbers: tmsb4x+/+, 1.8 ± 0.2, n = 14; tmsb4x+/-, 1.8 ± 0.2, n = 26; tmsb4x−/−, 1.7 ± 0.2, n = 18). Assessed by one-way ANOVA/Tukey's multiple comparisons test for regeneration length (tmsb4x+/+ vs. tmsb4x+/-, adjusted p = 0.018; tmsb4x+/+ vs. tmsb4x−/−, adjusted p = 0.0047; tmsb4x+/- vs. tmsb4x−/−, adjusted p = 0.71). Kruskal–Wallis test/Dunn's multiple comparisons test was used to assess the branch number (tmsb4x+/+ vs. tmsb4x+/-, adjusted p > 0.99; tmsb4x+/+ vs. tmsb4x−/−, adjusted p > 0.99; tmsb4x+/- vs. tmsb4x−/−, adjusted p > 0.99). The axon regeneration length refers to the distance from the injury site to the tip of the longest regenerating axon branch, as indicated by the distance between the asterisk and the arrow in the figure. Same as below. f Percentages of branch numbers of regenerated axons in the tmsb4x+/+, tmsb4x+/- and tmsb4−/− lines. Sample numbers: tmsb4x+/+, 14; tmsb4x+/-, 26; tmsb4x.−/−,18. g Representative images of axon regeneration with tmsb4x restored in tmsb4x knockout lines. Asterisks indicate the sites of axon injury, and arrows indicate the regenerated axon terminals. Scale bar, 100 μm. h and i Statistical graphs of the length (h) and branch number (i) of regenerated axons with vector and tmsb4x restored in tmsb4x knockout lines (length: vector, 209.0 ± 33.2 μm, n = 7; tmsb4x: 422.7 ± 53.1 μm, n = 9; branch number: vector, 1.9 ± 0.5; n = 7; tmsb4x: 4.4 ± 0.7, n = 9). Assessed by a two-tailed, Mann Whitney test for regeneration length (p = 0.00030). And an unpaired, two-trailed t test was used to assess the branch number. (p = 0.011) |
|
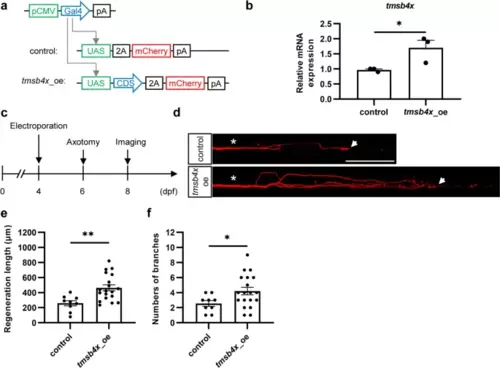
In vivo single-cell overexpression of tmsb4x promotes axon regeneration in Mauthner cells. a Schematic representation of the overexpression plasmids. b Efficiency of the tmsb4x overexpression plasmid. The data were assessed by an unpaired, two-tailed t test. p = 0.045. c Experimental workflow diagram. d Representative images of axon regeneration after tmsb4x overexpression. Asterisks indicate the sites of injury, and arrows indicate the regenerated axon terminals. Scale bar, 100 μm. e and f Statistical graphs of the length (e) and branch number (f) of regenerated axons overexpressing tmsb4x (length: control, 258.8 ± 34.4 μm; tmsb4x_oe, 464.1 ± 40.0 μm; branch number: control, 2.6 ± 0.4; tmsb4x_oe, 4.2 ± 0.5). The results were assessed by an unpaired, two-tailed t test (length, p = 0.0031; branch number, p = 0.042) |
|
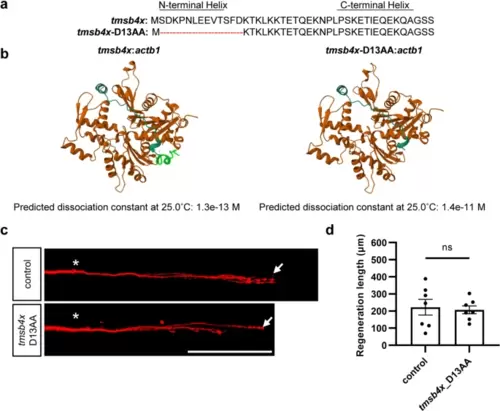
The 13 N-terminal amino acids of Tβ4 are essential for its axon regeneration-promoting activity. a Schematic representation of the protein sequence of tmsb4x and the mutant protein sequence with a deletion of the 13 N-terminal amino acids. b 3D models of wild-type (left) and N-terminal 13 amino acids deleted (right) Tβ4 in complex with β-actin, predicted by AlphaFold2. In the left image, the N-terminal 13 amino acids forming the α-helix are highlighted in green. Below the images are the dissociation constants predicted by PRODIGY based on the 3D models. c and d Representative images (c) and statistical analysis (d) of axon regeneration in zebrafish overexpressing mutant tmsb4x with deletion of the 13 N-terminal amino acids (control, 222.5 ± 45.5 μm, n = 7; tmsb4x_D13AA, 207.1 ± 23.1 μm, n = 7). The results were assessed by an unpaired, two-tailed t test, p = 0.77. The asterisks indicate the sites of injury, and the arrows indicate the terminals of the regenerated axon. Scale bar, 100 μm |
|
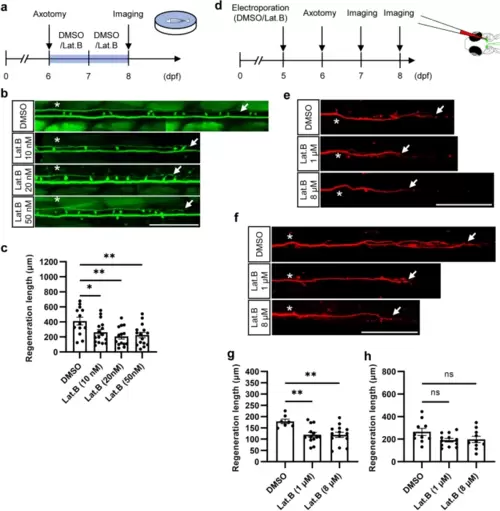
Lat. B inhibits axon regeneration in zebrafish. a Experimental workflow for the immersion method used to treat zebrafish larvae, with daily replacement of fresh drug after axon injury. b and c Representative images (b) and statistical analysis (c) of axon regeneration in zebrafish larvae treated with different concentrations of Lat. B (DMSO, 412.3 ± 51.4 μm, n = 13; Lat. B (10 nM), 261.5 ± 37.2 μm, n = 16; Lat. B (20 nM), 207.2 ± 34.3 μm, n = 14; Lat. B (50 nM), 225.1 ± 36.5 μm, n = 15). Assessed by one-way ANOVA/Dunnett's multiple comparisons test (Lat. B (10 nM), adjusted p = 0.027; Lat. B (20 nM), adjusted p = 0.0025; Lat. B (50 nM), adjusted p = 0.0053). The asterisks indicate the sites of injury, and the arrows indicate the terminals of the regenerated axon. Scale bar, 100 μm. d Experimental workflow for single-cell drug treatment. e and g Representative images (e) and statistical analysis (g) of axon regeneration 24 hpi in zebrafish larvae treated with different concentrations in single cells (DMSO, 179.0 ± 10.3 μm, n = 7; Lat. B (1 μM), 119.5 ± 10.9 μm, n = 13; Lat. B (8 μM), 119.2 ± 11.4 μm, n = 14). Assessed by one-way ANOVA/Dunnett's multiple comparisons test (Lat. B (1 μM), adjusted p = 0.0047; Lat. B (8 μM), adjusted p = 0.0040). The asterisks indicate the sites of injury, and the arrows indicate the terminals of the regenerated axon. Scale bar, 100 μm. f and h Representative images (f) and statistical analysis (h) of axon regeneration at 48 hpi in zebrafish larvae treated with different concentrations of Lat. B at the single-cell level. (DMSO, 264.6 ± 31.2 μm, n = 10; Lat. B (1 μM), 191.1 ± 16.4 μm, n = 12; Lat. B (8 μM), 197.9 ± 27.5 μm, n = 10). Assessed by one-way ANOVA/Dunnett's multiple comparisons test (Lat. B (1 μM), adjusted p = 0.077; Lat. B (8 μM), adjusted p = 0.13). The asterisks indicate the sites of injury, and the arrows indicate the terminals of the regenerated axon. Scale bar, 100 μm |
|
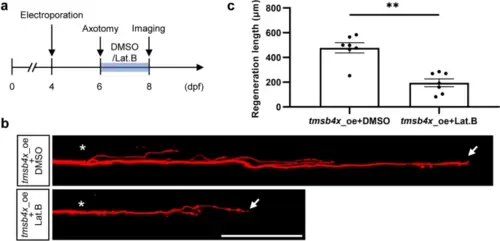
Lat. B blocks the regenerative effect of tmsb4x overexpression. a Experimental workflow. Lat. B was replaced daily. b and c Representative images (b) and statistical analysis (c) of axon regeneration in zebrafish larvae overexpressing tmsb4x treated with Lat. B immediately after axon injury and continuously for 48 h (tmsb4x_oe + DMSO, 477.7 ± 41.0 μm, n = 7; tmsb4x_oe + Lat. B, 195.0 ± 31.5 μm, n = 7). Assessed by a two-tailed, Mann Whitney test, p = 0.0041. The asterisks indicate the sites of injury, and the arrows indicate the terminals of the regenerated axon. Scale bar, 100 μm |
|
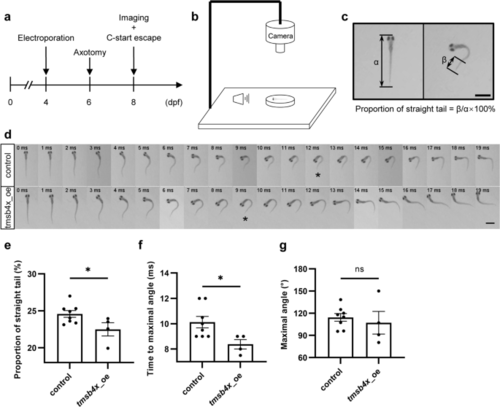
Overexpression of tmsb4x promotes the recovery of rapid escape behavior mediated by Mauthner cells. a Experimental workflow diagram. b Schematic representation of the experimental setup. c Schematic diagram illustrating the proportion of straight tails. α represents the total length of the zebrafish, and β represents the length of the straight tail. Scale bar, 1 mm. d Representative image sequences of Mauthner-mediated C-start escape behaviors upon tmsb4x overexpression. The asterisks indicate the images at the maximum angle. Scale bar, 1 mm. e to g. Statistical analysis of the proportion of straight tails (e), time to maximal angle (f), and maximal angle (g) of Mauthner-mediated C-start escape behaviors upon tmsb4x overexpression. Assessed by unpaired, two-tailed t test, p = 0.043 (e), p = 0.031 (f), p = 0.58 (g). Sample sizes: control, n = 8; tmsb4x_oe, n = 4 |
|
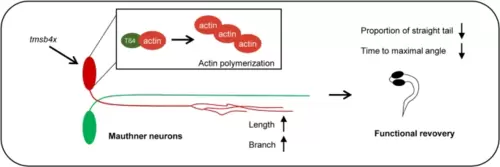
tmsb4x promotes axon regeneration of Mauthner cells in vivo. The overexpression of tmsb4x in single Mauthner cells enhances Mauthner axon regeneration by facilitating actin polymerization through binding to G-actin. This overexpression accelerated the rapid-escape function recovery mediated by Mauthner cells |

