
|
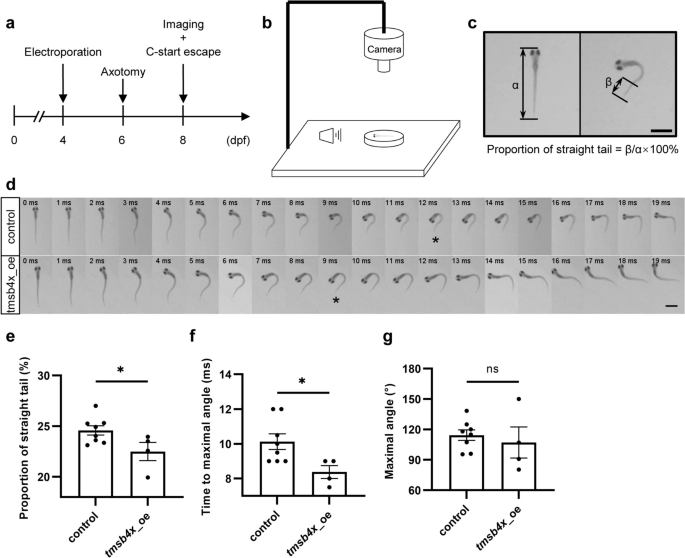
Fig. 7 Overexpression of tmsb4x promotes the recovery of rapid escape behavior mediated by Mauthner cells. a Experimental workflow diagram. b Schematic representation of the experimental setup. c Schematic diagram illustrating the proportion of straight tails. α represents the total length of the zebrafish, and β represents the length of the straight tail. Scale bar, 1 mm. d Representative image sequences of Mauthner-mediated C-start escape behaviors upon tmsb4x overexpression. The asterisks indicate the images at the maximum angle. Scale bar, 1 mm. e to g. Statistical analysis of the proportion of straight tails (e), time to maximal angle (f), and maximal angle (g) of Mauthner-mediated C-start escape behaviors upon tmsb4x overexpression. Assessed by unpaired, two-tailed t test, p = 0.043 (e), p = 0.031 (f), p = 0.58 (g). Sample sizes: control, n = 8; tmsb4x_oe, n = 4