FIGURE SUMMARY
Title

Anti-ovarian cancer migration and toxicity characteristics of a platinum(IV) pro-drug with axial HDAC inhibitor ligands in zebrafish models

Authors
Begum, S., Irvin, S.D., Cox, C.K., Huang, Z., Wilson, J.J., Monroe, J.D., Gibert, Y.
Source
Full text @ Invest New Drugs

Synthesis schema of cis, cis, trans-[Pt(NH3)2Cl2(PBA)2] [Compound B] Addition of 4-phenylbutanoic anhydride reagent to cis, cis, trans-[Pt(NH3)2Cl2(OH)2] results in the substitution of PBA HDAC inhibitor ligands for the hydroxides on cis, cis, trans-[Pt(NH3)2Cl2(OH)2]. See Supplementary Fig. S1 and S2 for NMR and HR-ESI-MS validation

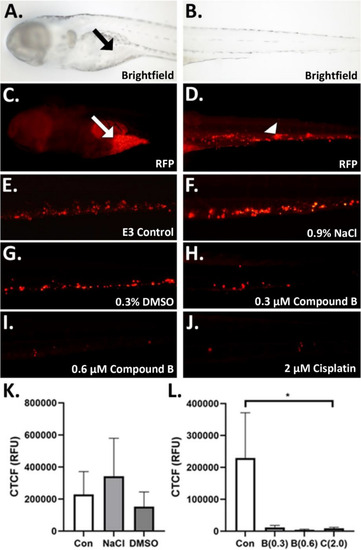
Compound B reduces ovarian cancer metastasis comparably to cisplatin.Images show ovarian cancer cells labeled with DiI membrane stain visible in the red fluorescent channel. A.-D. Representative images of microinjected zebrafish embryos (A. brightfield cranial view showing yolk sac injection site (black arrow); B. brightfield caudal view; C. red channel fluorescent cranial view showing yolk sac injection site with cancer cells (white arrow); D. red channel fluorescent caudal view showing metastasized A2780cis cells (white arrow head), E.-J. Representative images of control and experimental treatment zebrafish (E., E3 media control; F., 0.9% NaCl cisplatin control; G., 0.3% DMSO compound B control; H., 0.3 µM compound B; I., 0.6 µM compound B; J., 2.0 µM cisplatin). K. Comparison of E3 media (Con), 0.9% NaCl, and 0.3% DMSO controls. L. Comparison of E3 control (Con) with three platinum complex treatments: 0.3 µM compound B [B(0.3)], 0.6 µM compound B [B(0.6)], 2.0 µM cisplatin [C(2.0)]. CTCF = corrected total cell fluorescence; p < 0.05, “*” = 0.05; N = 5–15

Cisplatin and compound B treatment caused increased general tissue cell apoptosis in zebrafish AB embryos A.-F. Representative images of control and experimental compound (A., 0.3% DMSO; B., 0.3 µM compound B; C., 0.9% NaCl; D., 2 µM cisplatin; E., E3 media; F., 10 nM CCCP) treated zebrafish embryos). G. Graph of average number of apoptotic cells observed for control and experimental compound treated zebrafish embryos. Arrow in A. indicates caspase-3 positive cell. Key: Con = E3 egg water media control; C = cisplatin; C-V = cisplatin 0.9% NaCl vehicle control; B = compound B; B-V = 0.3% DMSO compound B vehicle; CCCP = 10 nM carbonyl cyanide m-chlorophenyl hydrazine positive control; p < 0.05, “*” = 0.05, “****” = 0.0001

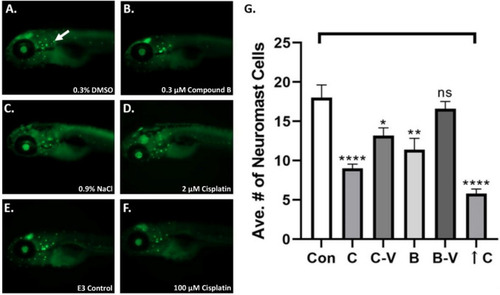
Cisplatin treatment decreased neuromast hair cell numbers more than compound B in brn3c(pouf4f3):eGFP zebrafish A.-F. Representative images of control and experimental compound (A., 0.3% DMSO; B., 0.3 µM compound B; C., 0.9% NaCl; D., 2 µM cisplatin; E., E3 media; F., 100 µM cisplatin) treated brn3c (pouf4f3):eGFP zebrafish embryos. G. Graph of average number of neuromast hair cells counted for control and experimental compound treated zebrafish embryos. Arrow in A. indicates neuromast expressing GFP reporter. Key: Con = E3 egg water media control; C = cisplatin; C-V = cisplatin 0.9% NaCl vehicle control; B = compound B; B-V = 0.3% DMSO compound B vehicle control; ↑C = 100 µM cisplatin overdose used as a positive control; p < 0.05, “*” = 0.05, “**” = 0.01, “****” = 0.0001, ns = non-significant

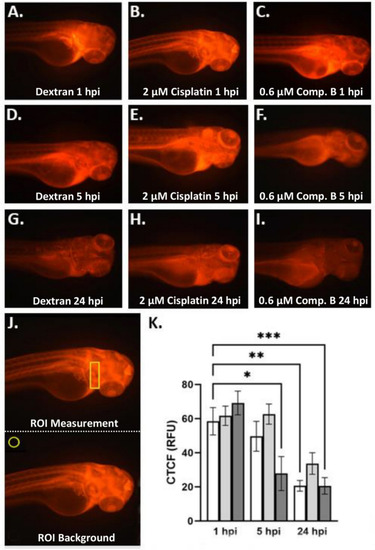
Compound B does not cause decreased glomerular filtration in AB zebrafish A.-I. Representative images of control and experimental compound treated AB zebrafish embryos showing red fluorescent dye distribution at 1, 5, and 24 hpi (A., dextran control-1 hpi; B., 2 µM cisplatin-1 hpi; C., 0.6 µM compound B-1 hpi; D., dextran control-5 hpi; E., 2 µM cisplatin-5 hpi; F., 0.6 µM compound B-5 hpi; G., dextran control-24 hpi; H., 2 µM cisplatin-24 hpi; I., 0.6 µM compound B-24 hpi; ), J. Examples of region-of-interest (ROI) analysis (top panel: representative polygon for ROI measurement of fluorescence; bottom panel: representative polygon for ROI measurement of background), K., Graph of fluorescent intensity for control and experimental compound treated zebrafish embryos at 1, 5, and 24 hpi. Key: CTCF (RFU) = corrected total cell fluorescence in relative fluorescence units; white columns = dextran control; light gray columns = 2 µM cisplatin; dark gray columns = 0.6 µM compound B; p < 0.05, “*” = 0.05, “**” = 0.01, “***” = 0.001; N = 5–10

Acknowledgments
This image is the copyrighted work of the attributed author or publisher, and ZFIN has permission only to display this image to its users. Additional permissions should be obtained from the applicable author or publisher of the image. Full text @ Invest New Drugs