FIGURE

Fig. 5

ID
ZDB-FIG-241209-18
Publication
Begum et al., 2024 - Anti-ovarian cancer migration and toxicity characteristics of a platinum(IV) pro-drug with axial HDAC inhibitor ligands in zebrafish models
Other Figures
All Figure Page
Back to All Figure Page
Fig. 5

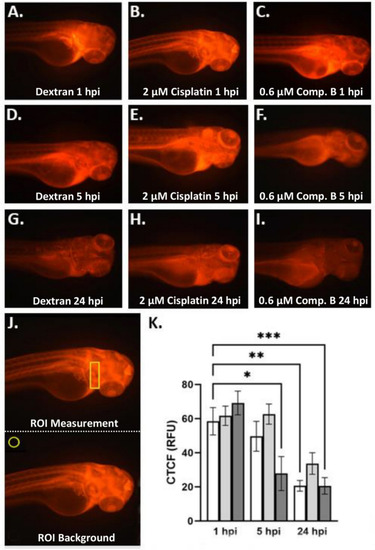
Compound B does not cause decreased glomerular filtration in AB zebrafish A.-I. Representative images of control and experimental compound treated AB zebrafish embryos showing red fluorescent dye distribution at 1, 5, and 24 hpi (A., dextran control-1 hpi; B., 2 µM cisplatin-1 hpi; C., 0.6 µM compound B-1 hpi; D., dextran control-5 hpi; E., 2 µM cisplatin-5 hpi; F., 0.6 µM compound B-5 hpi; G., dextran control-24 hpi; H., 2 µM cisplatin-24 hpi; I., 0.6 µM compound B-24 hpi; ), J. Examples of region-of-interest (ROI) analysis (top panel: representative polygon for ROI measurement of fluorescence; bottom panel: representative polygon for ROI measurement of background), K., Graph of fluorescent intensity for control and experimental compound treated zebrafish embryos at 1, 5, and 24 hpi. Key: CTCF (RFU) = corrected total cell fluorescence in relative fluorescence units; white columns = dextran control; light gray columns = 2 µM cisplatin; dark gray columns = 0.6 µM compound B; p < 0.05, “*” = 0.05, “**” = 0.01, “***” = 0.001; N = 5–10

Expression Data

Expression Detail
Antibody Labeling
Phenotype Data

Phenotype Detail
Acknowledgments
This image is the copyrighted work of the attributed author or publisher, and ZFIN has permission only to display this image to its users. Additional permissions should be obtained from the applicable author or publisher of the image. Full text @ Invest New Drugs