
- Title
-
Zonated Wnt/β-catenin signal-activated cardiomyocytes at the atrioventricular canal promote coronary vessel formation in zebrafish
- Authors
- Chiba, A., Yamamoto, T., Fukui, H., Fukumoto, M., Shirai, M., Nakajima, H., Mochizuki, N.
- Source
- Full text @ Dev. Cell
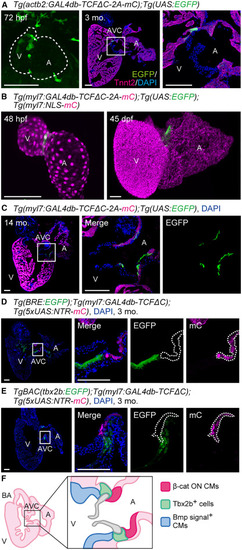
Myocardial Wnt/β-catenin signal-activated zone exists at the AVC in embryonic and adult stages (A) Representative confocal images of the hearts of Tg(actb2:GAL4db-TCFΔC-2A-mCherry);Tg(UAS:EGFP) fish. A ventral view of the heart at 72 h post-fertilization (hpf) (left). A cryosection image of the heart at 3 months stained with anti-GFP and anti-troponin T type 2 (Tnnt2) antibodies and 4′,6-diamidino-2-phenylindole (DAPI) (center). The boxed region is enlarged (right). Dotted lines outline the heart. Images shown in all figures are 3D-rendered confocal images of a stack unless otherwise noted. Confocal images in all figures are representative of at least three individuals. (B) Representative images of the hearts of Tg(myl7:GAL4db-TCFΔC-2A-mCherry);Tg(UAS:EGFP);Tg(myl7:NLS-mCherry) fish. A ventral view of the heart at 48 hpf (left). A resected heart at 45 days post-fertilization (dpf) was made transparent with clear, unobstructed brain/body imaging cocktails and computational analysis reagent-1A (CUBIC-1A) (right). Tg(myl7:NLS-mCherry) was used to outline the heart shape because the fluorescence of myl7:NLS-mCherry is brighter than that of myl7:GAL4db-TCFΔC-2A-mCherry. (C) A representative cryosection image of the heart of a 14-month-old Tg(myl7:GAL4db-TCFΔC-2A-mCherry);Tg(UAS:EGFP) fish stained with DAPI (left). The boxed region is enlarged (center and right). The fluorescence channel is indicated at the top. (D) A representative cryosection image of the heart of a 3-month-old Tg(BRE:EGFP);Tg(myl7:GAL4db-TCFΔC);Tg(5xUAS:NTR-mCherry) fish stained with DAPI (left). The boxed region is enlarged (right). Bmp signal+ cells do not overlap with β-cat ON CMs (dotted lines). (E) A representative cryosection image of the heart of a TgBAC(tbx2b:EGFP);Tg(myl7:GAL4db-TCFΔC);Tg(5xUAS:NTR-mCherry) fish at 3 months stained with DAPI (left). The boxed region is enlarged (right). Tbx2b+ cells do not overlap with β-cat ON CMs (dotted lines). (F) Schematic zonation at the AVC demarcated by the markers. β-cat ON CMs, Tbx2b+ cells, and Bmp signal+ cells were observed in the CMs at the atrial side of the AVC, at the root of the valves, and on the ventricular side of the AVC, respectively. Scale bars, 100 μm. A, atrium; AVC, atrioventricular canal; BA, bulbus arteriosus; CM, cardiomyocyte; mo, month; V, ventricle. See also Figure S1 and Videos S1A and S1B. |
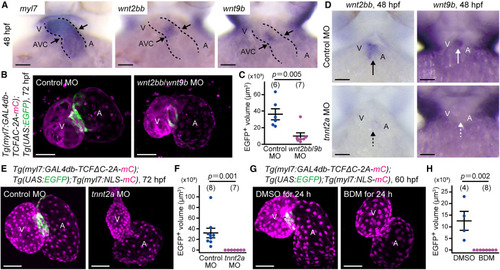
Heartbeat-dependent Wnt expression turns on Wnt/β-catenin signaling in AVC CMs (A) Representative stereomicrographs of whole-mount in situ hybridization (WISH) analyses of myl7 (left), wnt2bb (center), and wnt9b (right) mRNA expression in three zebrafish embryos at 48 hpf. Ventral views. Dotted lines outline the heart. Arrows indicate the AVC. (B) Representative images of the hearts of Tg(myl7:GAL4db-TCFΔC-2A-mCherry);Tg(UAS:EGFP) larvae at 72 hpf injected with 7 ng control morpholino oligonucleotide (MO) (left) and 5 ng wnt2bb and 2 ng wnt9b MO (right). (C) Quantitative analysis of the data shown in (B). The volume of the UAS:EGFP+ region was measured. In this and the following graphs, unless otherwise described, each dot represents an individual fish, and the number of fish analyzed is indicated at the top. (D) Representative stereomicrographs of WISH analyses of wnt2bb (left) and wnt9b (right) mRNA expression in four embryos at 48 hpf. Embryos were injected with 2 ng control MO (top) and 2 ng tnnt2a MO (bottom). Arrows and broken arrows indicate positive and less mRNA expression, respectively. (E) Representative images of the hearts of Tg(myl7:GAL4db-TCFΔC-2A-mCherry);Tg(UAS:EGFP);Tg(myl7:NLS-mCherry) larvae at 72 hpf injected with 2 ng control MO (left) and 2 ng tnnt2a MO (right). (F) Quantitative analysis of the data shown in (E). (G) Representative images of the hearts of Tg(myl7:GAL4db-TCFΔC-2A-mCherry);Tg(UAS:EGFP);Tg(myl7:NLS-mCherry) embryos at 60 hpf treated with DMSO (left) or 20 mM 2,3-butanedione 2-monoxime (BDM) (right) for 24 h. (H) Quantitative analysis of the data shown in (G). Scale bars, 50 μm. Data are mean ± SEM. Statistical analysis was performed by Mann-Whitney U test. See also Figure S2. |
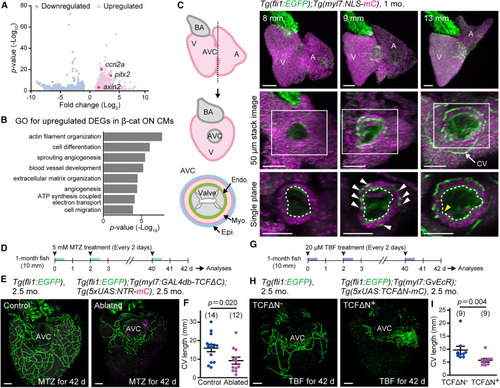
β-cat ON CMs contribute to CV formation (A) A volcano plot showing differentially expressed genes (DEGs) between β-cat ON and OFF CMs (n = 3). Note that Wnt target genes (red circle) were upregulated. (B) Gene Ontology (GO) enrichment analysis of genes upregulated in β-cat ON CMs. (C) Schematic illustration of the heart (left) and representative images of the hearts of 1-month-old Tg(fli1:EGFP);Tg(myl7:NLS-mCherry) fish with body length indicated at the top (right). Hearts were made transparent with CUBIC-1A. Lateral projections (top), 50 μm stacked images of the dorsal view around the AVC (middle), and single slice images of the boxed regions (bottom). Dotted lines outline the heart lumen. Endothelial cells (ECs) are observed in the CM layer (white arrowheads). Coronary vessels (CVs) connect with endoECs at the AVC (yellow arrowhead). (D) Experimental design for specific ablation of nitroreductase-expressing (NTR-expressing) cells of the fish used in (E) by metronidazole (MTZ) treatment. 1-month-old fish were treated with 5 mM MTZ every 2 days and analyzed after 42 days of treatment. (E) Representative images of the CVs of Tg(fli1:EGFP) or Tg(fli1:EGFP);Tg(myl7:GAL4db-TCFΔC);Tg(5xUAS:NTR-mCherry) fish at 2.5 months treated with MTZ. A control heart (left) and a β-cat ON CM-ablated heart (right). (F) Quantitative analysis of the data shown in (E). The length of CVs was measured by tracing the length of fli1:EGFP+ coECs. (G) Experimental design for CM-specific induction of dominant negative TCF (TCFΔN) by tebufenozide (TBF) treatment in the fish used in (H). Fish were treated with 20 μM TBF every 2 days and analyzed after 42 days. (H) Representative images of the CVs of Tg(fli1:EGFP) or Tg(fli1:EGFP);Tg(myl7:GvEcR);Tg(5xUAS:TCFΔN-mCherry) fish at 2.5 months treated with TBF. A control heart (left) or a TCFΔN-expressed heart (right). (I) Quantitative analysis of the data shown in (H). Scale bars, 100 μm. Data are mean ± SEM. Statistical analysis was performed by two-tailed Student’s t test (F) or Mann-Whitney U test (I). CV, coronary vessel; Endo, endocardium; Epi, epicardium; Myo, myocardium. See also Figure S3, Table S1, and Video S1C. |
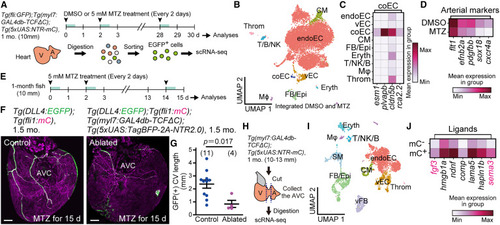
β-cat ON CMs are required for CV arterialization (A) An experimental design of preparation of cells followed by scRNA-seq. fli1:EGFP+ cells were collected from the fish treated with DMSO or 5 mM MTZ every 2 days. (B) Uniform manifold approximation and projection (UMAP) visualization of integrated cells from DMSO-treated and MTZ-treated hearts. Cells are color-coded by type. endoEC, endocardial EC; coEC, coronary EC; vEC, valvular EC; Epi, epicardial cells; FB, fibroblasts; Eryth, erythrocytes; T, T cells; NK, natural killer cells; B, B cells; Mϕ, macrophages; Throm, thrombocytes. (C) A matrix plot of coEC marker gene expression (bottom) in each cluster (left) shown in (B). (D) A matrix plot of arterial marker gene expression (bottom) of coECs from hearts treated with DMSO (upper) or MTZ (lower). (E) Experimental design to analyze the CV of the fish used in (F). Fish were treated with 5 mM MTZ every 2 days and analyzed after 15 days of treatment. (F) Representative images of arteries and CVs of control or Tg(DLL4:EGFP);Tg(myl7:GAL4db-TCFΔC);Tg(5xUAS:TagBFP-2A-NTR2.0) fish at 1.5 months treated with MTZ. A control heart (left) and a β-cat ON CM-ablated heart (right). (G) Quantitative analysis of the data shown in (F). (H) Experimental design for preparing the cells at the AVC followed by scRNA-seq. The fish indicated at the top treated with DMSO for 48 h were used. (I) UMAP visualization of cells obtained from the AVC of the fish in (H) at 1 month. Cells are color-coded by type. vFB, valvular FB; SM, smooth muscle cells. (J) A matrix plot of ligand expression (bottom) in β-cat OFF (mC−) and ON (mC+) CMs of the AVCs at 1 month. Scale bars, 100 μm. Data are mean ± SEM. Statistical analysis was performed by two-tailed Student’s t test. BF, bright field. See also Figure S4 and Table S2. |
Reprinted from Developmental Cell, 60(1), Chiba, A., Yamamoto, T., Fukui, H., Fukumoto, M., Shirai, M., Nakajima, H., Mochizuki, N., Zonated Wnt/β-catenin signal-activated cardiomyocytes at the atrioventricular canal promote coronary vessel formation in zebrafish, 21-29.e8, Copyright (2024) with permission from Elsevier. Full text @ Dev. Cell