
- Title
-
CXCR3-CXCL11 Signaling Restricts Angiogenesis and Promotes Pericyte Recruitment
- Authors
- Lee, J., Goeckel, M.E., Levitas, A., Colijn, S., Shin, J., Hindes, A., Mun, G., Burton, Z., Chintalapati, B., Yin, Y., Abello, J., Solnica-Krezel, L., Stratman, A.
- Source
- Full text @ Arterio., Thromb., and Vas. Bio.
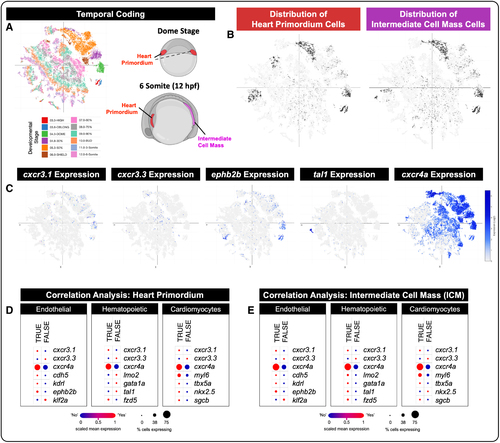
Single-cell analysis of zebrafish embryos reveals expression of cxcr3 isoforms in the heart primordium and intermediate cell mass during development. A, Using publicly available single-cell sequencing data sets from the studies by Farrell et al41 and Sur et al,42 we show a UMAP (Uniform Manifold Approximation and Projection) plot of cell populations temporally coded across developmental stages from the dome stage to the 6-somite stage. Cartoons of dome stage and 6-somite zebrafish embryos show where our cell lineages of interest are located anatomically at each stage. Red, heart primordium; magenta, intermediate cell mass. Schematics in A were generated using biorender.com. B, Distribution (ie, location) of heart primordium cells and intermediate cell mass cells (dark gray dots) within the temporal coded UMAP plot (light gray dots). C, UMAP plots of gene expression (blue dots) show individual cells that express cxcr3.1, cxcr3.3, eph2b2 (endothelial cell marker), tal1 (hematopoietic lineage marker), and cxcr4a (broad endothelial, hematopoietic, and neuronal marker) across all developmental stages. Darker blue dots equate to higher gene expression; gray dots equate to no gene expression. D and E, Correlation analysis (Spearman) of markers that define the heart primordium (D) and the intermediate cell mass (E) with cxcr3.1, cxcr3.3, and known endothelial, hematopoietic, and cardiomyocyte markers. Red color indicates a positive correlation, and blue color indicates a negative correlation; size of the dot corresponds to the percent of cells in a given lineage that express the indicated gene. As shown, the endothelial and cardiomyocyte markers correlate with the heart primordium, suggesting that these 2 cell types derive from this precursor population. Endothelial, hematopoietic, and some cardiomyocyte markers correlate with the intermediate cell mass, suggesting all 3 lineages can arise from these precursors. |
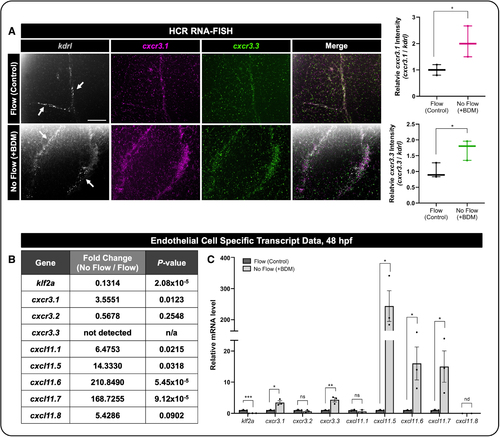
cxcr3.1, cxcr3.3, and cxcl11 isoforms are expressed in endothelial cells (ECs), and their transcripts are responsive to blood flow. A, Left, Representative hybridization chain reaction RNA fluorescence in situ hybridization (HCR RNA-FISH) images from the zebrafish cranial vasculature (single plane)—kdrl (gray), cxcr3.1 (magenta), and cxcr3.3 (green). Representative of 5/5 individual embryos. Flow was either allowed to start normally (Flow) or inhibited by the addition of 2,3-butanedione 2-monoxime (BDM) at 22 hpf (No Flow). Both cxcr3.1 and cxcr3.3 transcripts were increased in the vasculature in response to impaired blood flow. Scale bars represent 50 µm. Right, Quantification of the relative cxcr3.1 or cxcr3.3 intensity in zebrafish. Relative intensity of cxcr3.1 or cxcr3.3 normalized to kdrl was quantified between flow and no-flow conditions. Each dot represents an individual zebrafish (n=3). Statistical analyses were performed using unpaired t tests. Data are presented as box plots that display the median value with first and third quartiles and min/max bars. B, mRNA isolated via the translational ribosomal affinity purification (TRAP) protocol (Figure S4) and then mRNA sequencing was used to assess EC-specific transcript levels of klf2a, cxcr3.1, cxcr3.2, cxcr3.3, cxcl11.1, cxcl11.5, cxcl11.6, cxcl11.7, and cxcl11.8. The data represent 2 RNA-sequencing (RNA-Seq) replicates of 2000 embryos each and are presented as a table that displays the mean±SEM and P values reported from the RNA-Seq analysis. C, Expression levels of the indicated mRNA transcripts relative to gapdh measured by qRT-PCR (quantitative reverse transcription polymerase chain reaction) with and without blood flow using the TRAP protocol. Data represent the mean±SEM of 3 independent experiments (n=3). Statistical analyses were performed using unpaired t tests comparing each individual transcript between flow and no-flow conditions. *P<0.05, **P<0.005, ***P<0.0005. P>0.05 (ns). nd indicates not detected. |

CXCR3 (CXC motif chemokine receptor 3) contributes to cranial angiogenesis in the developing zebrafish. A through C, Representative images of Tg(fli1a:GFP) zebrafish treated with dimethyl sulfoxide (DMSO) vehicle control (A), the Cxcr3 antagonist (AMG487; B), or the Cxcr3 agonist (VUF11222; C). Pharmacological reagents were added to the zebrafish water at 32 hpf, and embryos were imaged at 54 hpf to view changes in vascularization. A′ through C′, Magnified insets. Scale bars=500 µm (A–C) and 50 µm (A′–C′). D, Quantification of the vascular area, normalized to the DMSO control (n=19 DMSO, n=13 AMG487, and n=14 VUF11222). E, Average number of endothelial cell (EC) vessel branch points in the frontal lobe of the zebrafish brain (the region shown in the images; n=6 DMSO, n=5 AMG487, and n=5 VUF11222). F, Average vessel length. To account for any changes in mounting angle of the samples, a vessel length ratio was calculated by measuring the length of each vessel and then dividing by the distance from the top of the eye to the top of the skull for each fish (n=6 DMSO, n=3 AMG487, and n=4 VUF11222). G, Representative confocal images of cranial vascular networks at 72 hpf in wild-type or homozygous cxcr3.1Δ7/Δ7 cxcr3.2Δ2Δ2 cxcr3.3Δ8Δ8 triple mutant animals. Scale bar=250 µm. H, Quantification of the vascular area normalized to the wild-type control average (n=16 wild-type 72 hpf, n=67 triple mutant 72 hpf, n=6 wild-type 96 hpf, and n=49 triple mutant 96 hpf). For D, E, F, and H, each dot represents an individual zebrafish. One outlier was identified and removed from the VUF11222 group in D as per the ROUT method (Q=1%). Statistics for D, E, and F were calculated using 1-way ANOVA with Dunnett multiple comparisons test. H was analyzed with 2-way ANOVA with Sidak multiple comparisons. Omnibus ANOVA P values (before the post hoc tests) are <0.0001 (D), 0.0649 (E), 0.729 (F), and <0.0001 (H). Data are presented as box plots that display the median value with first and third quartiles and min/max bars. ***P<0.0005, ****P<0.0001. P>0.05 (ns). |
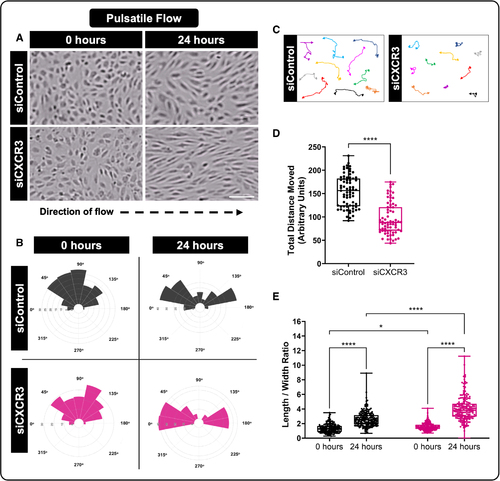
CXCR3 (CXC motif chemokine receptor 3) modulates endothelial cell (EC) motility and cellular alignment in response to a pulsatile flow regimen. A, Representative images of EC alignment to pulsatile flow at 0 and 24 hours, using ECs transfected with control (siControl) or siRNA against CXCR3 (siCXCR3). Scale bar=100 µm. B, Distribution angles of the siControl (gray) or siCXCR3 (magenta) EC’s longest axis relative to the direction of flow at 0 and 24 hours. C and D, Analysis of siControl or siCXCR3 motility under pulsatile flow for 24 hours. C, Representative cell tracks where arrowheads represent the direction of cellular movement and circles represent the starting point of individual cells. D, Quantification of the total distance of movement from the cells’ origin. E, Quantification of the length/width aspect ratio of siControl or siCXCR3 ECs under pulsatile flow at 0 and 24 hours. For D (n=71) and E (n=180), each dot represents an individual cell, pooled from 3 individual experiments. Statistical analyses were performed using the Mann-Whitney U test (D) and Kruskal-Wallis test with Dunn multiple comparisons test (E; omnibus P<0.0001). Data are presented as box plots that display the median value with first and third quartiles and min/max bars. All portions represent data from at least 3 independent experiments. *P<0.05, ****P<0.0001. |
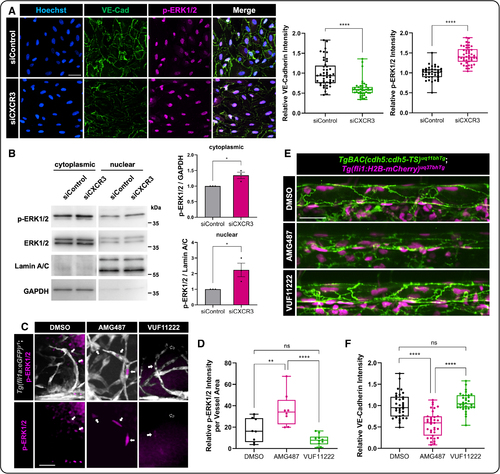
CXCR3 (CXC motif chemokine receptor 3) inhibition affects endothelial cell (EC) responses to flow, including EC junctional stability and phosphorylated extracellular signal-regulated kinase 1/2 (p-ERK1/2) activation. A, Representative immunostaining images of siControl or siCXCR3 ECs exposed to pulsatile flow for 24 hours. VE-cadherin (vascular endothelial cadherin; green), p-ERK1/2 (magenta), and nuclei (blue; Hoechst). The intensities of VE-cadherin (n=45) and p-ERK1/2 (n=40 and 46) were calculated from ≈150 cells, from at least 15 independent fields per condition. Scale bar=50 µm. B, Western blot analysis of cytoplasmic and nuclear fractions of human umbilical vein endothelial cells (HUVECs) transfected with siControl or siCXCR3 and exposed to pulsatile flow for 24 hours. Antibodies against p-ERK1/2, T. ERK1/2 (extracellular signal-regulated kinase 1/2), lamin A/C, or GAPDH are shown. By densitometry, relative amounts of p-ERK1/2 protein normalized to lamin A/C (nuclear) or GAPDH (cytoplasmic) were quantified. Data represent the mean±SEM of 3 independent experiments (n=3). C, Representative images of whole-mount immunofluorescent staining of p-ERK1/2 in dimethyl sulfoxide (DMSO) control, AMG487, and VUF11222 treated Tg(fli1a:GFP) zebrafish (vessels in gray). White arrows show positive p-ERK1/2 immunostaining (magenta), while the open arrows show p-ERK1/2–negative nuclei. Scale bar=25 µm. D, Quantification of the relative p-ERK1/2 intensity normalized to the vessel area within the vasculature of the frontal lobe of the zebrafish (n=8 DMSO, n=8 AMG487, and n=10 VUF11222). E, Representative images from the Tg(vecad:TS); Tg(fli:nls-mCherry) double transgenic zebrafish line marking endothelial cell nuclei in magenta and VE-cadherin in green. AMG487, VUF11222, vs DMSO were added to the zebrafish water at 24 hpf, and embryos were imaged mid-trunk at 48 hpf to view changes in EC-EC junctions. Scale bar=25 µm. F, Quantification of the relative VE-cadherin intensity in the zebrafish. Intensity analysis of VE-cadherin was quantified by automated GFP (green fluorescent protein) masking (n=34 DMSO, n=35 AMG487, and n=32 VUF11222). For D and F, each dot represents an individual zebrafish. Statistical analyses were performed using Mann-Whitney U tests (A), unpaired t tests (B), and 1-way ANOVA with Tukey multiple comparisons test (D and F). Omnibus ANOVA P values (before the post hoc tests) are <0.0001 (D) and <0.0001 (F). Except B, data are presented as box plots that display the median value with first and third quartiles and min/max bars. *P<0.05, **P<0.005, ****P<0.0001. P>0.05 (ns). |
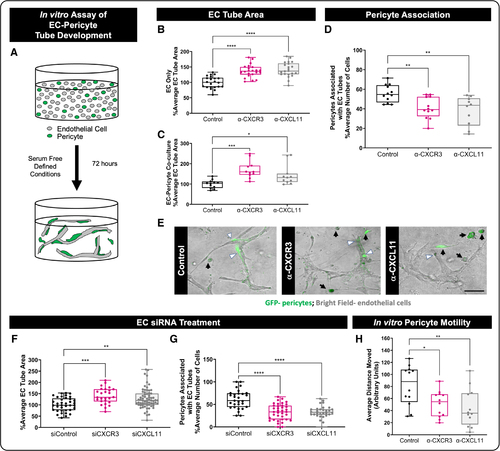
Endothelial cell (EC) CXCR3 (CXC motif chemokine receptor 3) and CXCL11 (CXC motif chemokine ligand 11) inhibition promotes EC tube formation and suppresses pericyte recruitment in vitro. A, Schematic of 3-dimensional (3D) collagen type I EC-pericyte tube assembly assays. ECs and pericytes are used in a 5:1 ratio, and the pericytes are GFP (green fluorescent protein) labeled for visualization. B and C, EC% average tube area measured from assays without (B; n=22) and with (C; n=12 control, n=11 α-CXCR3, and n=11 α-CXCL11, independent cultures) pericytes present. Cultures were treated with neutralizing antibodies to CXCR3 (α-CXCR3) or to CXCL11 (α-CXCL11), and cultures were then allowed to assemble tubes for 72 hours. Neutralization of CXCR3 or CXCL11 leads to expanded EC tube area regardless of the presence or absence of pericytes. D, When pericytes are present, neutralization of CXCR3 or CXCL11 leads to reduced pericyte association with EC tubes (n=12 control, n=12 α-CXCR3, and n=10 α-CXCL11, independent cultures). E, Representative image of the 3D EC-pericyte cocultures at 72 hours. ECs are shown by bright field, and pericytes are GFP labeled. White arrow heads indicate pericytes associated with EC tubes, and black arrows indicate pericytes that are not associated with EC tubes. F and G, To determine whether these effects are EC autonomous, we utilized siRNA to suppress CXCR3 (siCXCR3) or CXCL11 (siCXCL11) only in ECs, then incorporated these ECs into the 3D collagen gel assay with wild-type pericytes. EC tube area is increased in siCXCR3 and siCXCL11 conditions compared with the siControl condition (F; n=37 siControl, n=26 siCXCR3, and n=67 siCXCL11, independent cultures). Pericyte association with EC tubes is decreased following EC siCXCR3 or siCXCL11 treatment (G; n=29 siControl, n=37 siCXCR3, and n=30 siCXCL11, independent cultures). All data are normalized to the control condition. H, Quantification of the distance that pericytes migrate in 3D collagen gel assays treated with neutralizing antibodies suggests that pericyte motility is impaired when CXCR3-CXCL11 signaling is inhibited (n=12, independent cultures). For B through D and F through H, each dot represents an individual 3D collagen assay. Statistical analyses were performed using 1-way ANOVA with Dunnett multiple comparisons test (B–D, G, and H) and Kruskal-Wallis test with Dunn multiple comparisons (F). Omnibus ANOVA P values (before the post hoc tests) are <0.0001 (B), 0.0006 (C), 0.0021 (D), 0.0003 (F), <0.0001 (G), and 0.0081 (H). Data are presented as box plots that display the median value with first and third quartiles and min/max bars. *P<0.05, **P<0.005, ***P<0.0005, ****P<0.0001. |
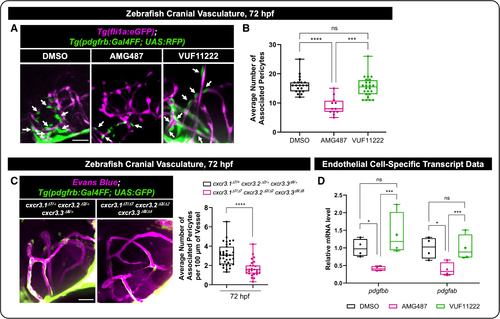
CXCR3 (CXC motif chemokine receptor 3) promotes endothelial cell (EC) transcription of pdgfb and pericyte recruitment to blood vessels in vivo. A, Representative images from the Tg(fli1a:GFP); Tg(pdgfrb:Gal4FF; UAS:RFP) double transgenic zebrafish line, marking endothelial cells in magenta and pericytes in green. Arrows point to pericytes that are associated with the cranial vasculature in 72 hpf zebrafish. Dimethyl sulfoxide (DMSO), AMG487 (Cxcr3 inhibition), or VUF11222 (Cxcr3 activator) was added at 32 hpf. Imaging is done in the zebrafish forebrain. Scale bar=50 µm. B, Quantification of the number of pericytes associated with the vessels in the zebrafish forebrain following DMSO control (n=21), AMG487 (n=12), or VUF11222 (n=24) treatment at 72 hpf. Each dot represents an individual zebrafish. C, Representative images and quantification of the cxcr3.1Δ7/Δ7 cxcr3.2Δ2/Δ2 cxcr3.3Δ8/Δ8 triple mutants vs triple heterozygous controls on the Tg(pdgfrb:gal4ff); (UAS:GFP) transgenic line, marking pericytes in green. Vascular networks were labeled by injection of Evans blue into the sinus venosus at 72 hpf, followed by immediate confocal imaging. Quantification of the number of pericytes associated per 100 µm of the vessels in zebrafish forebrain. Each dot represents an individual zebrafish (n=35 heterozygous control and n=27 triple mutant). Scale bar=50 µm. D, EC-specific mRNA was isolated using translational ribosomal affinity purification (TRAP) isolation protocols (Figure S4) following DMSO control, AMG487, or VUF11222 treatment. Expression levels of pdgfbb and pdgfab normalized to gapdh were examined by qRT-PCR (quantitative reverse transcription polymerase chain reaction). Each dot represents data from an independent experiment (n=4). Statistical analyses were performed using the Kruskal-Wallis test with Dunn multiple comparisons (B), Mann-Whitney U test (C), and 2-way ANOVA with Sidak multiple comparisons test (D). Omnibus ANOVA P values (before the post hoc tests) are <0.0001 (B) and 0.0004 (D). Data are presented as box plots that display the median value with first and third quartiles and min/max bars. *P<0.05, ***P<0.0005, ****P<0.0001. P>0.05 (ns). |