
Fig. 7
- ID
- ZDB-FIG-241219-24
- Publication
- Lee et al., 2024 - CXCR3-CXCL11 Signaling Restricts Angiogenesis and Promotes Pericyte Recruitment
- Other Figures
- All Figure Page
- Back to All Figure Page
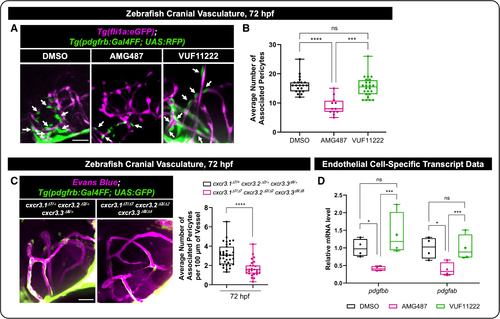
CXCR3 (CXC motif chemokine receptor 3) promotes endothelial cell (EC) transcription of pdgfb and pericyte recruitment to blood vessels in vivo. A, Representative images from the Tg(fli1a:GFP); Tg(pdgfrb:Gal4FF; UAS:RFP) double transgenic zebrafish line, marking endothelial cells in magenta and pericytes in green. Arrows point to pericytes that are associated with the cranial vasculature in 72 hpf zebrafish. Dimethyl sulfoxide (DMSO), AMG487 (Cxcr3 inhibition), or VUF11222 (Cxcr3 activator) was added at 32 hpf. Imaging is done in the zebrafish forebrain. Scale bar=50 µm. B, Quantification of the number of pericytes associated with the vessels in the zebrafish forebrain following DMSO control (n=21), AMG487 (n=12), or VUF11222 (n=24) treatment at 72 hpf. Each dot represents an individual zebrafish. C, Representative images and quantification of the cxcr3.1Δ7/Δ7 cxcr3.2Δ2/Δ2 cxcr3.3Δ8/Δ8 triple mutants vs triple heterozygous controls on the Tg(pdgfrb:gal4ff); (UAS:GFP) transgenic line, marking pericytes in green. Vascular networks were labeled by injection of Evans blue into the sinus venosus at 72 hpf, followed by immediate confocal imaging. Quantification of the number of pericytes associated per 100 µm of the vessels in zebrafish forebrain. Each dot represents an individual zebrafish (n=35 heterozygous control and n=27 triple mutant). Scale bar=50 µm. D, EC-specific mRNA was isolated using translational ribosomal affinity purification (TRAP) isolation protocols (Figure S4) following DMSO control, AMG487, or VUF11222 treatment. Expression levels of pdgfbb and pdgfab normalized to gapdh were examined by qRT-PCR (quantitative reverse transcription polymerase chain reaction). Each dot represents data from an independent experiment (n=4). Statistical analyses were performed using the Kruskal-Wallis test with Dunn multiple comparisons (B), Mann-Whitney U test (C), and 2-way ANOVA with Sidak multiple comparisons test (D). Omnibus ANOVA P values (before the post hoc tests) are <0.0001 (B) and 0.0004 (D). Data are presented as box plots that display the median value with first and third quartiles and min/max bars. *P<0.05, ***P<0.0005, ****P<0.0001. P>0.05 (ns). |