
|
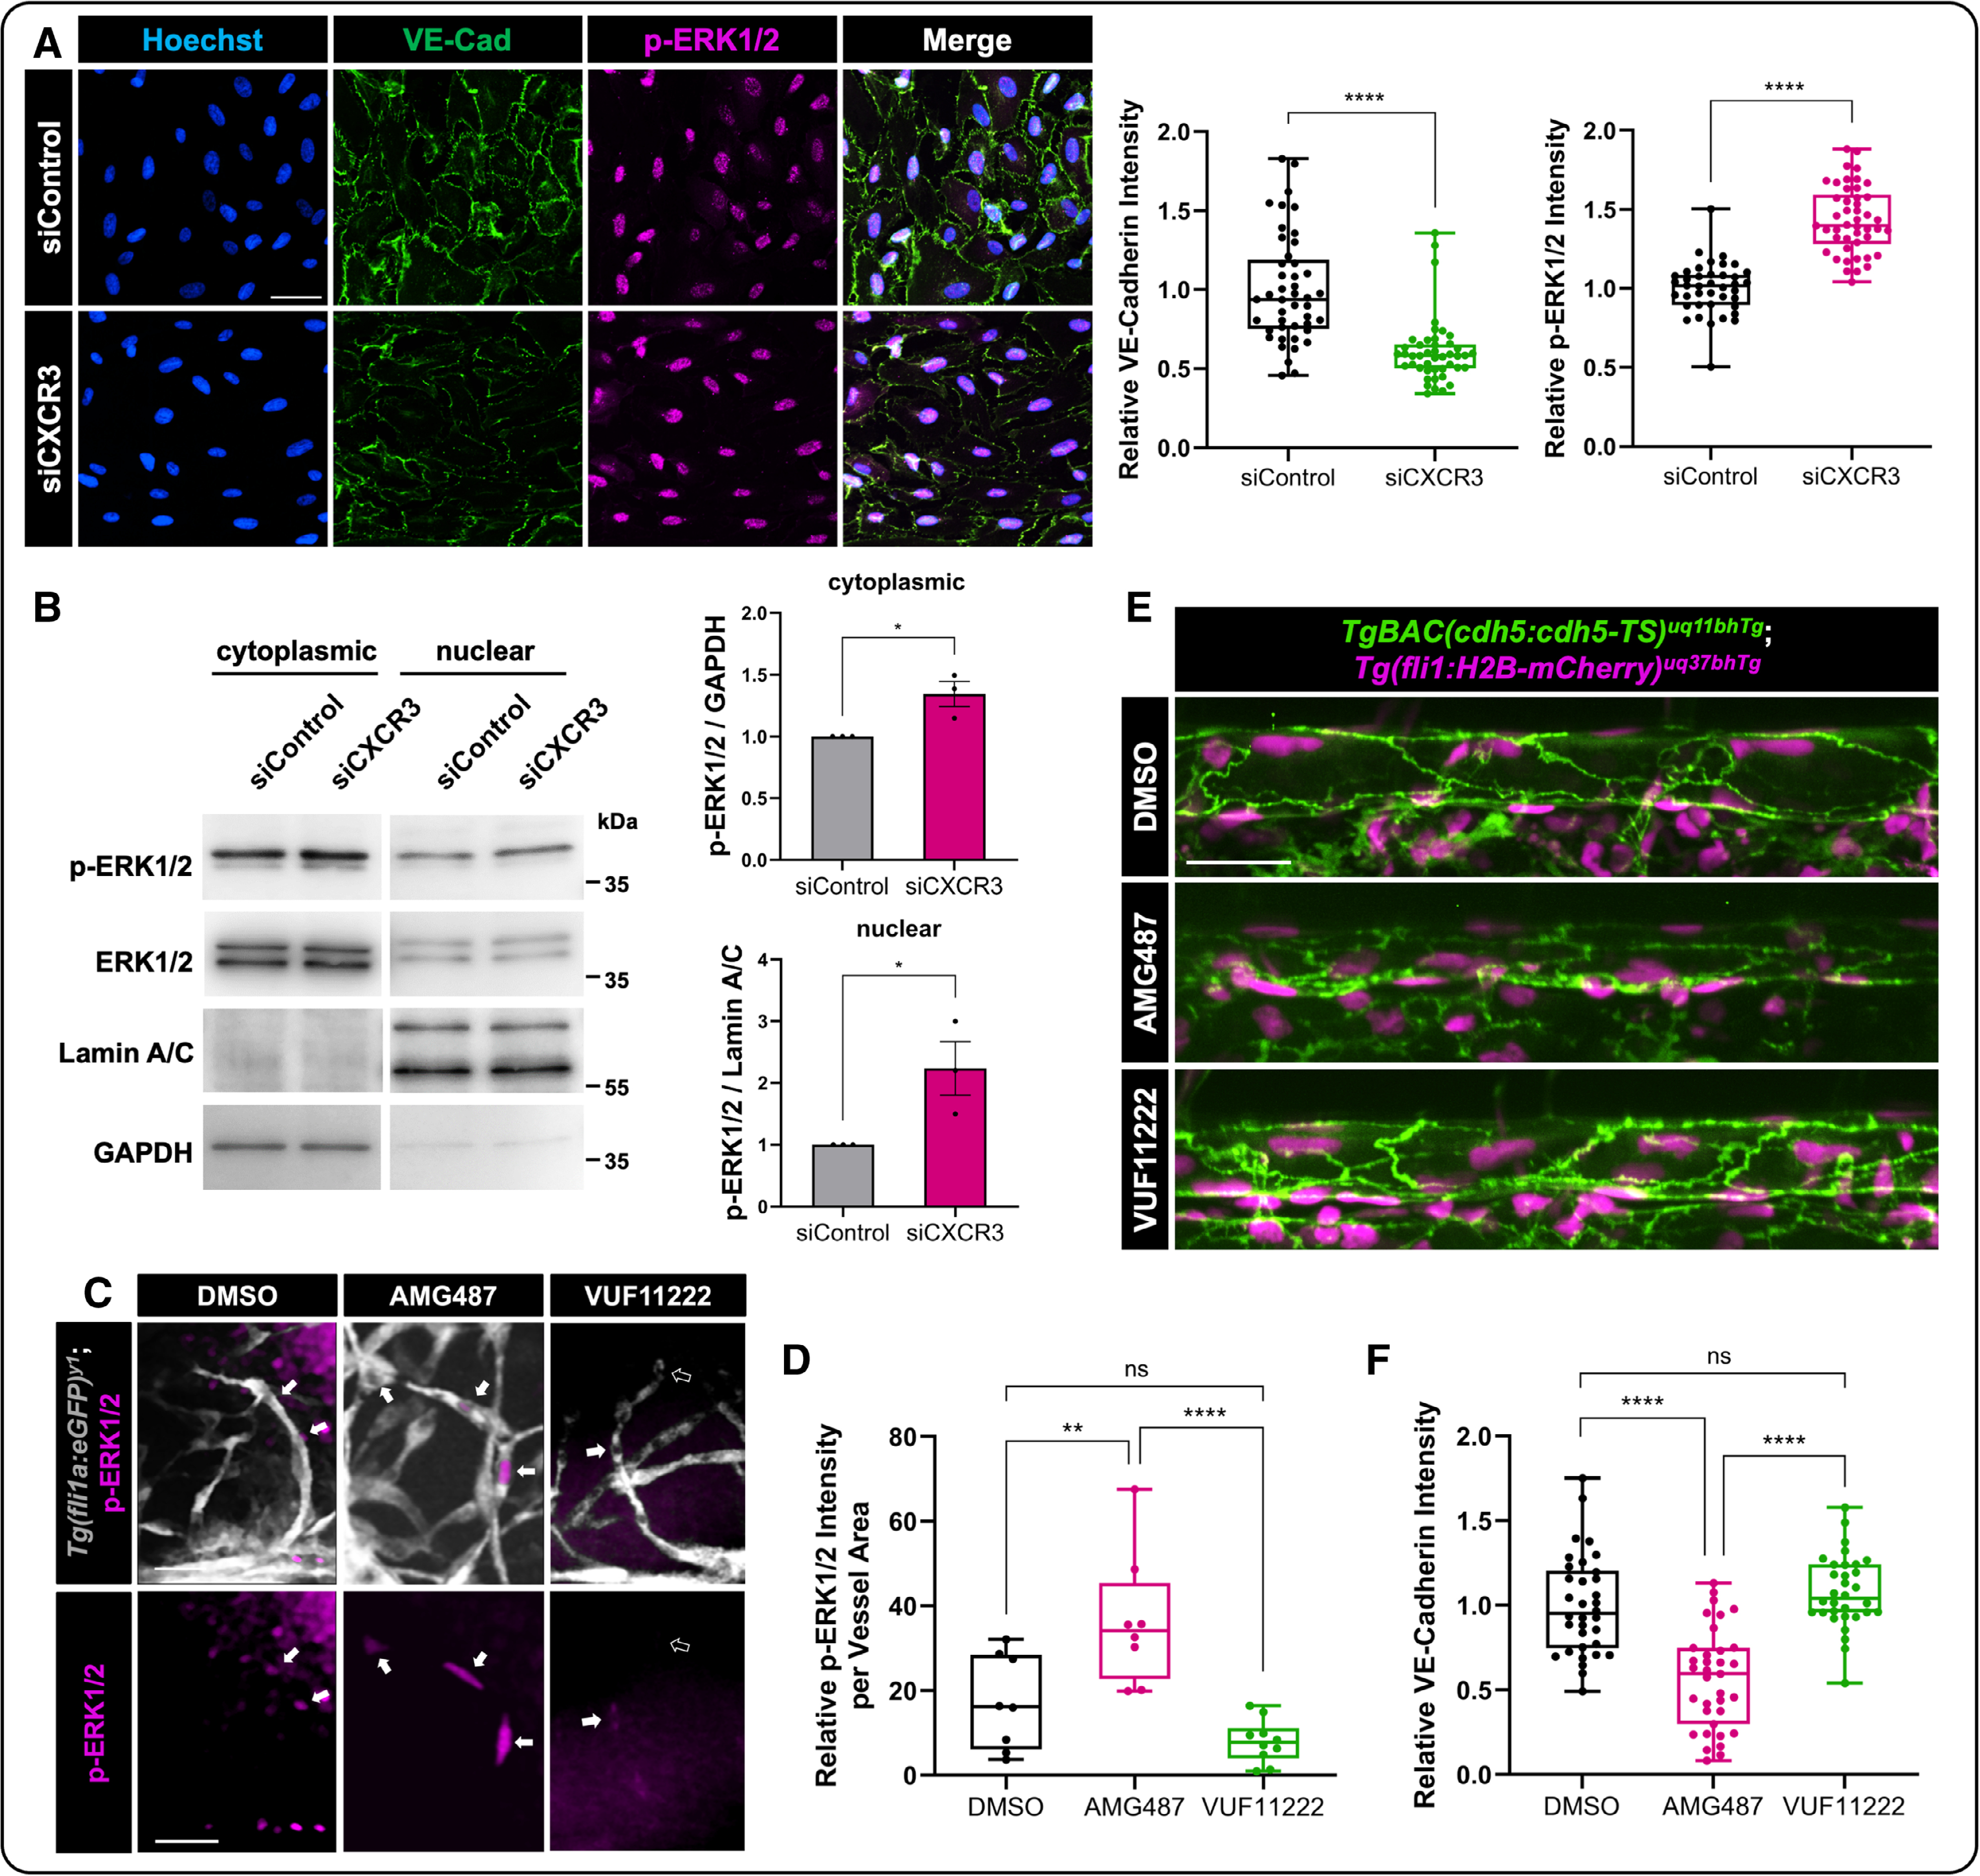
Fig. 5 CXCR3 (CXC motif chemokine receptor 3) inhibition affects endothelial cell (EC) responses to flow, including EC junctional stability and phosphorylated extracellular signal-regulated kinase 1/2 (p-ERK1/2) activation. A, Representative immunostaining images of siControl or siCXCR3 ECs exposed to pulsatile flow for 24 hours. VE-cadherin (vascular endothelial cadherin; green), p-ERK1/2 (magenta), and nuclei (blue; Hoechst). The intensities of VE-cadherin (n=45) and p-ERK1/2 (n=40 and 46) were calculated from ≈150 cells, from at least 15 independent fields per condition. Scale bar=50 µm. B, Western blot analysis of cytoplasmic and nuclear fractions of human umbilical vein endothelial cells (HUVECs) transfected with siControl or siCXCR3 and exposed to pulsatile flow for 24 hours. Antibodies against p-ERK1/2, T. ERK1/2 (extracellular signal-regulated kinase 1/2), lamin A/C, or GAPDH are shown. By densitometry, relative amounts of p-ERK1/2 protein normalized to lamin A/C (nuclear) or GAPDH (cytoplasmic) were quantified. Data represent the mean±SEM of 3 independent experiments (n=3). C, Representative images of whole-mount immunofluorescent staining of p-ERK1/2 in dimethyl sulfoxide (DMSO) control, AMG487, and VUF11222 treated Tg(fli1a:GFP) zebrafish (vessels in gray). White arrows show positive p-ERK1/2 immunostaining (magenta), while the open arrows show p-ERK1/2–negative nuclei. Scale bar=25 µm. D, Quantification of the relative p-ERK1/2 intensity normalized to the vessel area within the vasculature of the frontal lobe of the zebrafish (n=8 DMSO, n=8 AMG487, and n=10 VUF11222). E, Representative images from the Tg(vecad:TS); Tg(fli:nls-mCherry) double transgenic zebrafish line marking endothelial cell nuclei in magenta and VE-cadherin in green. AMG487, VUF11222, vs DMSO were added to the zebrafish water at 24 hpf, and embryos were imaged mid-trunk at 48 hpf to view changes in EC-EC junctions. Scale bar=25 µm. F, Quantification of the relative VE-cadherin intensity in the zebrafish. Intensity analysis of VE-cadherin was quantified by automated GFP (green fluorescent protein) masking (n=34 DMSO, n=35 AMG487, and n=32 VUF11222). For D and F, each dot represents an individual zebrafish. Statistical analyses were performed using Mann-Whitney U tests (A), unpaired t tests (B), and 1-way ANOVA with Tukey multiple comparisons test (D and F). Omnibus ANOVA P values (before the post hoc tests) are <0.0001 (D) and <0.0001 (F). Except B, data are presented as box plots that display the median value with first and third quartiles and min/max bars. *P<0.05, **P<0.005, ****P<0.0001. P>0.05 (ns).