
Fig. 2
- ID
- ZDB-FIG-241219-19
- Publication
- Lee et al., 2024 - CXCR3-CXCL11 Signaling Restricts Angiogenesis and Promotes Pericyte Recruitment
- Other Figures
- All Figure Page
- Back to All Figure Page
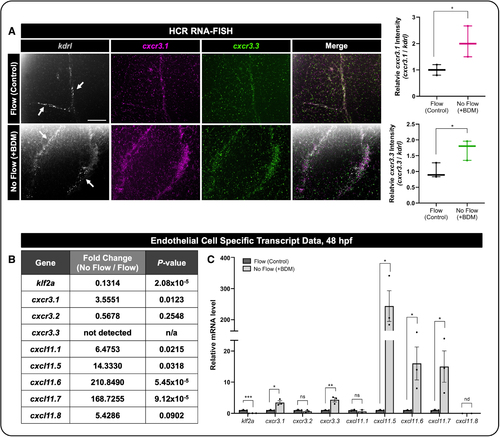
cxcr3.1, cxcr3.3, and cxcl11 isoforms are expressed in endothelial cells (ECs), and their transcripts are responsive to blood flow. A, Left, Representative hybridization chain reaction RNA fluorescence in situ hybridization (HCR RNA-FISH) images from the zebrafish cranial vasculature (single plane)—kdrl (gray), cxcr3.1 (magenta), and cxcr3.3 (green). Representative of 5/5 individual embryos. Flow was either allowed to start normally (Flow) or inhibited by the addition of 2,3-butanedione 2-monoxime (BDM) at 22 hpf (No Flow). Both cxcr3.1 and cxcr3.3 transcripts were increased in the vasculature in response to impaired blood flow. Scale bars represent 50 µm. Right, Quantification of the relative cxcr3.1 or cxcr3.3 intensity in zebrafish. Relative intensity of cxcr3.1 or cxcr3.3 normalized to kdrl was quantified between flow and no-flow conditions. Each dot represents an individual zebrafish (n=3). Statistical analyses were performed using unpaired t tests. Data are presented as box plots that display the median value with first and third quartiles and min/max bars. B, mRNA isolated via the translational ribosomal affinity purification (TRAP) protocol (Figure S4) and then mRNA sequencing was used to assess EC-specific transcript levels of klf2a, cxcr3.1, cxcr3.2, cxcr3.3, cxcl11.1, cxcl11.5, cxcl11.6, cxcl11.7, and cxcl11.8. The data represent 2 RNA-sequencing (RNA-Seq) replicates of 2000 embryos each and are presented as a table that displays the mean±SEM and P values reported from the RNA-Seq analysis. C, Expression levels of the indicated mRNA transcripts relative to gapdh measured by qRT-PCR (quantitative reverse transcription polymerase chain reaction) with and without blood flow using the TRAP protocol. Data represent the mean±SEM of 3 independent experiments (n=3). Statistical analyses were performed using unpaired t tests comparing each individual transcript between flow and no-flow conditions. *P<0.05, **P<0.005, ***P<0.0005. P>0.05 (ns). nd indicates not detected. |