
Fig. 1
- ID
- ZDB-FIG-241219-18
- Publication
- Lee et al., 2024 - CXCR3-CXCL11 Signaling Restricts Angiogenesis and Promotes Pericyte Recruitment
- Other Figures
- All Figure Page
- Back to All Figure Page
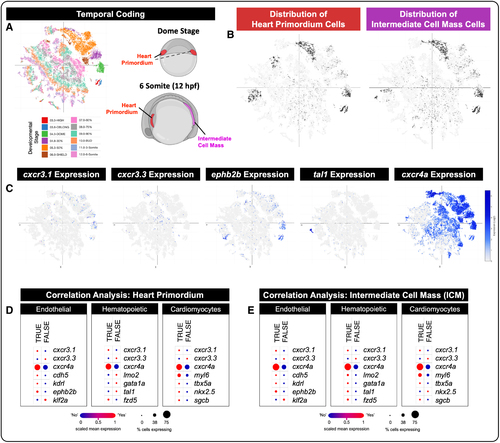
Single-cell analysis of zebrafish embryos reveals expression of cxcr3 isoforms in the heart primordium and intermediate cell mass during development. A, Using publicly available single-cell sequencing data sets from the studies by Farrell et al41 and Sur et al,42 we show a UMAP (Uniform Manifold Approximation and Projection) plot of cell populations temporally coded across developmental stages from the dome stage to the 6-somite stage. Cartoons of dome stage and 6-somite zebrafish embryos show where our cell lineages of interest are located anatomically at each stage. Red, heart primordium; magenta, intermediate cell mass. Schematics in A were generated using biorender.com. B, Distribution (ie, location) of heart primordium cells and intermediate cell mass cells (dark gray dots) within the temporal coded UMAP plot (light gray dots). C, UMAP plots of gene expression (blue dots) show individual cells that express cxcr3.1, cxcr3.3, eph2b2 (endothelial cell marker), tal1 (hematopoietic lineage marker), and cxcr4a (broad endothelial, hematopoietic, and neuronal marker) across all developmental stages. Darker blue dots equate to higher gene expression; gray dots equate to no gene expression. D and E, Correlation analysis (Spearman) of markers that define the heart primordium (D) and the intermediate cell mass (E) with cxcr3.1, cxcr3.3, and known endothelial, hematopoietic, and cardiomyocyte markers. Red color indicates a positive correlation, and blue color indicates a negative correlation; size of the dot corresponds to the percent of cells in a given lineage that express the indicated gene. As shown, the endothelial and cardiomyocyte markers correlate with the heart primordium, suggesting that these 2 cell types derive from this precursor population. Endothelial, hematopoietic, and some cardiomyocyte markers correlate with the intermediate cell mass, suggesting all 3 lineages can arise from these precursors. |