FIGURE SUMMARY
Title

Beyond basic characterization and omics: Immunomodulatory roles of platelet-derived extracellular vesicles unveiled by functional testing

Authors
Palviainen, M., Puutio, J., Østergaard, R.H., Eble, J.A., Maaninka, K., Butt, U., Ndika, J., Kari, O.K., Kamali-Moghaddam, M., Kjaer-Sorensen, K., Oxvig, C., Aransay, A.M., Falcon-Perez, J.M., Federico, A., Greco, D., Laitinen, S., Hayashi, Y., Siljander, P.R.
Source
Full text @ J Extracell Vesicles

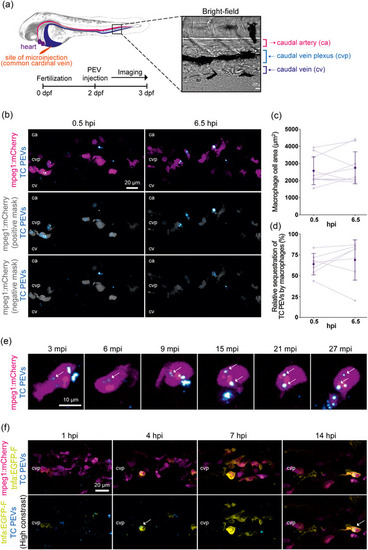
Interaction of macrophages with PEVs in vivo. Fluorescently labeled PEVs from platelets activated by TC co‐stimulation were intravenously injected into zebrafish embryos at 2 dpf and live‐imaged. (a) Left panel shows a simplified schematic of the site of microinjection and the main blood vessels including the ca, cv and cvp along with a representative BF image of the tissue area imaged. Right panel shows an overview of the experimental setup. (b)–(d) Tg(mpeg1:mCherry) embryos were imaged every 20 min from 0.5 to 6.5 hpi. Representative images show the total TC PEV signals (cyan) and macrophages (magenta) at two time points (top panel). The two lower panels display the same images after segmentation by a macrophage‐specific mask (gray) to determine PEV colocalization with macrophage reporters in spatial x‐y‐z dimensions. The panel with the ‘positive mask’ shows only TC PEV signals colocalizing with macrophages, while the ‘negative mask’ panel reveals those that are excluded, such as associations with cells other than macrophages. Scale bar = 20 µm. (c)–(d) Image analysis. trendlines represent individual embryos in light purple (n = 10) with mean ± SEM in dark purple (n = 7, after excluding embryos where macrophages were moving in and out of the field of view). Relative TC PEV sequestration by macrophages (d) is the area ratio of the macrophage‐masked TC PEVs (b, middle panel) to the total TC PEVs (b, top panel). (e) Tg(mpeg1:mCherry) embryos were injected and imaged in a time‐lapse sequence from 3 to 27  mpi with a focus on the interactions of TC PEVs (cyan) with a single macrophage (magenta). Arrows indicate TC PEVs that colocalize with the macrophage reporter. Scale bar = 10 µm. (f) Tg(mpeg1:mCherry); Tg(tnfa:EGFP‐F) embryos at 2 dpf were injected with fluorescently labeled TC PEVs and imaged every 30 min from 1 to 14 hpi. Representative images show transcriptional activation of tumor necrosis factor‐alpha (tnfa, yellow) over time in macrophages (magenta) with or without sequestered TC PEVs (cyan). Arrows indicate examples of macrophages that had sequestered TC PEVs and induced tnfa. Scale bar = 20 µm. Anterior left, dorsal top. BF, bright‐field; ca, caudal artery; cv, caudal vein; cvp, CV plexus; dpf, days post‐fertilization; hpi, hours post‐injection; mpi, minutes post‐injection; PEVs, platelet‐derived extracellular vesicles; TC, thrombin and collagen.

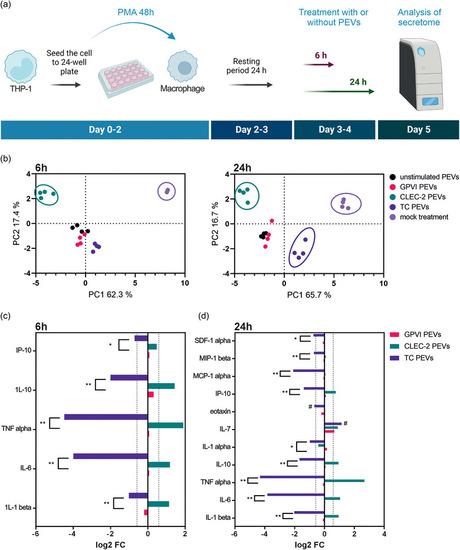
Changes in the macrophage cytokine secretomes induced by the different PEV types. (a) Flow chart of the experiment. THP‐1 cells were differentiated into macrophages by 48 h incubation with 50 nM PMA. After a resting period of 24 h, macrophages were treated with the different PEV types (n = 4; biological replicates representing 16 donors) or left untreated for 6 or 24 h, after which the media was collected, processed, and analyzed for 34 cytokines using a Luminex inflammation panel. Figure created with BioRender.com. (b) Principal component analysis of the cytokine secretomes of macrophages at 6 and 24 h. Secretomes from the mock‐treated macrophages remained distinct from the PEV‐induced secretomes at both time points. The CLEC‐2 PEV‐induced secretome separated from the other PEV‐induced secretomes at 6 h, and the TC PEV‐induced secretome separated from the other PEV‐induced secretomes at 24 h. The secretomes from the macrophages treated with the GPVI or US PEVs remained grouped together. (c) Bar graph showing fold changes (>1.5 fold change, 0.585 log2 FC) in the fluorescence intensities of cytokines from the GPVI, CLEC‐2 and TC PEV‐treated macrophages compared to the cytokines from the macrophages treated with the US PEVs at 6 h. Statistical differences between the GPVI, CLEC‐2 or TC PEV‐induced secretomes are marked with asterisks (*p ≤ 0.05, **p ≤ 0.01, Friedman test), and the differences between the GPVI, CLEC‐2 or TC PEV‐induced secretomes compared to the secretome induced by the US PEVs are marked with a pound sign (#). (d) Bar graph showing fold changes (>1.5 fold change, 0.585 log2 FC) in the fluorescence intensities of cytokines induced by the GPVI, CLEC‐2, or TC PEV‐treated macrophages compared to the cytokines from the macrophages treated with the US PEVs at 24 h. Statistical differences between the cytokines induced by the GPVI, CLEC‐2 or TC PEVs are marked with asterisks (*p ≤ 0.05, **p ≤ 0.01, Friedman test), and the differences between the GPVI, CLEC‐2 or TC PEV‐induced secretomes compared to the secretome induced by the US PEVs are marked with a pound sign (#). PEVs, platelet‐derived extracellular vesicles.

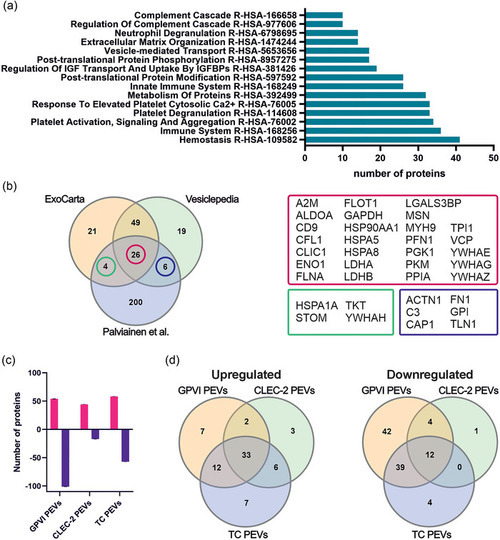
Comparison of the receptor‐induced differences in the protein cargo of PEVs analyzed with mass spectrometry (n = 3; biological replicates representing 12 donors). (a) Bar graph showing the top 15 pathways based on the number of proteins involved in the pathway (≥10, adjusted p‐value ≤ 0.05). (b) Venn diagram comparing the 240 identified proteins, ExoCarta top 100 and Vesiclepedia top 100 proteins reveals 26 proteins shared by the three datasets. In addition, this dataset shares four proteins with the ExoCarta top 100 proteins, and six with the Vesiclepedia top 100 proteins, respectively. (c) Bar graph illustrating the upregulated (red) and downregulated (purple) proteins when the proteomes of the GPVI, CLEC‐2 and TC PEVs were compared to the proteome of the US PEVs. Statistical significance was determined with multiple unpaired t‐tests with Benjamini, Krieger and Yekutieli test correction. (d) Venn diagrams of upregulated and downregulated proteins in the GPVI, CLEC‐2 and TC PEVs in comparison to the US PEVs. PEVs, platelet‐derived extracellular vesicles.

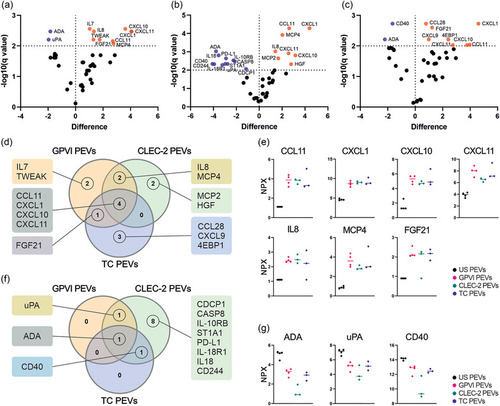
Quantitative analysis of the targets of the inflammation panel by PEA revealed distinctive receptor‐dependent tuning of the PEV proteins. PEVs isolated by iodixanol cushion ultracentrifugation were analysed for 80 inflammation panel targets. The GPVI (n = 4; biological replicates representing 16 donors), CLEC‐2 (n = 3; biological replicates representing 12 donors) and TC PEVs (n = 3; biological replicates representing 12 donors) were compared to the PEVs from unstimulated platelets (US PEVs, n = 4; biological replicates representing 16 donors). Statistical significance was determined with multiple unpaired t‐tests with Benjamini, Krieger and Yekutieli test correction. Results are presented as volcano plots for each PEV type displaying the differentially expressed inflammatory proteins compared with those in the US PEVs. Proteins are graphed by difference in means (SO 0.1, x axis) and significance (FDR q < 0.05, y axis). Proteins in orange are upregulated, and in purple downregulated compared to the proteins in the US PEVs. (a) Volcano plot of the GPVI PEVs compared to the US PEVs shows nine upregulated and two downregulated proteins. (b) Volcano plot of the CLEC‐2 PEVs compared to the US PEVs shows eight upregulated and 11 downregulated proteins. (c) Volcano plot of the TC PEVs compared to the US PEVs shows eight upregulated and two downregulated proteins. (d) Venn diagram of significantly upregulated proteins in the GPVI, CLEC‐2 and TC PEVs. (e) Plots illustrating the median expression of seven inflammatory proteins, CCL11, CXCL1. CXCL10, CXCL11, IL8 (CXCL8), MCP4 (CCL13), FGF21, which were upregulated in at least two PEV types. (f) Venn diagram of significantly downregulated proteins in the GPVI, CLEC‐2 and TC PEVs compared to the US PEVs. (g) Median expression of three inflammatory proteins, ADA, uPA and CD40, which were downregulated in at least two PEV types. Statistical significance was calculated with multiple unpaired t‐tests with Benjamini, Krieger and Yekutieli test correction to control the FDR. PEA, proximity extension assay; PEVs, platelet‐derived extracellular vesicles.

Comparison of the miRNA content of unstimulated platelets and the differentially induced PEVs (n = 4; biological replicates representing 16 donors). (a) Principal component analysis of the 541 shared miRNAs show quantitative differences between platelets and PEVs. The US, GPVI, CLEC‐2 and TC PEV miRNAs overlap with each other, and separation is only observed in comparison to the miRNAs of unstimulated platelets. (b) Venn diagram of the DEGs in the US, GPVI, CLEC‐2 and TC PEV miRNAs compared to the platelet miRNAs. Numbers of the differentially up‐ or downregulated miRNAs in PEVs in comparison to the miRNAs of unstimulated platelets are indicated in brackets. (c) Bar graph of the top 10 pathways (p ≤ 0.01) affected by the upregulated miRNAs in the differentially induced PEVs compared to platelets. Analysis was performed using the DESeq2 algorithm and the p‐values were corrected for multiple testing with FDR method. (d) Venn diagram of the upregulated miRNA DEGs of the GPVI, CLEC‐2 and TC PEVs compared to the US PEVs. (e) Venn diagram of the downregulated miRNA DEGs of the GPVI, CLEC‐2 and TC PEVs compared to the US PEVs. DEGs, differentially expressed genes; FDR, false discovery rate; PEVs, platelet‐derived extracellular vesicles.

Acknowledgments
This image is the copyrighted work of the attributed author or publisher, and ZFIN has permission only to display this image to its users. Additional permissions should be obtained from the applicable author or publisher of the image. Full text @ J Extracell Vesicles