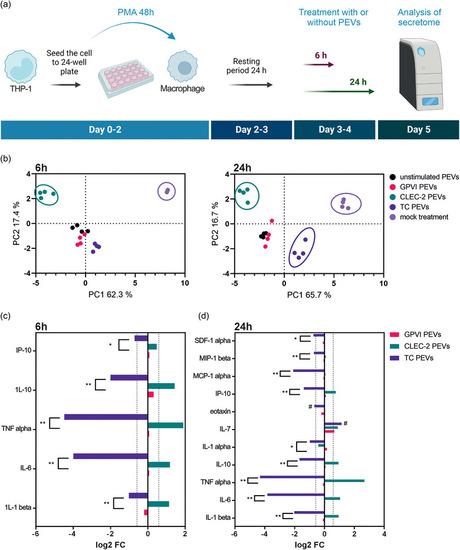
Changes in the macrophage cytokine secretomes induced by the different PEV types. (a) Flow chart of the experiment. THP‐1 cells were differentiated into macrophages by 48 h incubation with 50 nM PMA. After a resting period of 24 h, macrophages were treated with the different PEV types (n = 4; biological replicates representing 16 donors) or left untreated for 6 or 24 h, after which the media was collected, processed, and analyzed for 34 cytokines using a Luminex inflammation panel. Figure created with BioRender.com. (b) Principal component analysis of the cytokine secretomes of macrophages at 6 and 24 h. Secretomes from the mock‐treated macrophages remained distinct from the PEV‐induced secretomes at both time points. The CLEC‐2 PEV‐induced secretome separated from the other PEV‐induced secretomes at 6 h, and the TC PEV‐induced secretome separated from the other PEV‐induced secretomes at 24 h. The secretomes from the macrophages treated with the GPVI or US PEVs remained grouped together. (c) Bar graph showing fold changes (>1.5 fold change, 0.585 log2 FC) in the fluorescence intensities of cytokines from the GPVI, CLEC‐2 and TC PEV‐treated macrophages compared to the cytokines from the macrophages treated with the US PEVs at 6 h. Statistical differences between the GPVI, CLEC‐2 or TC PEV‐induced secretomes are marked with asterisks (*p ≤ 0.05, **p ≤ 0.01, Friedman test), and the differences between the GPVI, CLEC‐2 or TC PEV‐induced secretomes compared to the secretome induced by the US PEVs are marked with a pound sign (#). (d) Bar graph showing fold changes (>1.5 fold change, 0.585 log2 FC) in the fluorescence intensities of cytokines induced by the GPVI, CLEC‐2, or TC PEV‐treated macrophages compared to the cytokines from the macrophages treated with the US PEVs at 24 h. Statistical differences between the cytokines induced by the GPVI, CLEC‐2 or TC PEVs are marked with asterisks (*p ≤ 0.05, **p ≤ 0.01, Friedman test), and the differences between the GPVI, CLEC‐2 or TC PEV‐induced secretomes compared to the secretome induced by the US PEVs are marked with a pound sign (#). PEVs, platelet‐derived extracellular vesicles.
|
