IMAGE

FIGURE 1

ID
ZDB-IMAGE-240930-57
Source
Figures for Palviainen et al., 2024
Image
Figure Caption

FIGURE 1

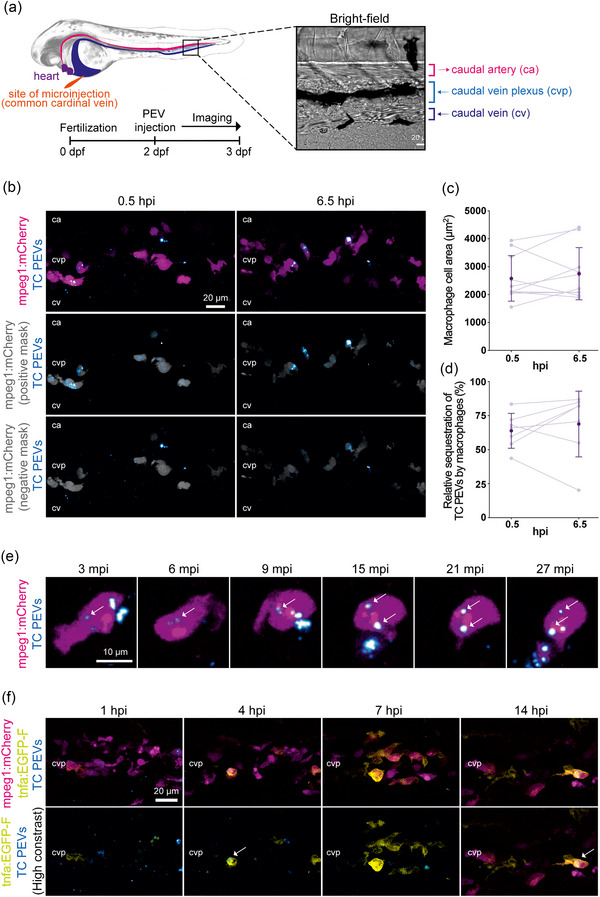
Interaction of macrophages with PEVs in vivo. Fluorescently labeled PEVs from platelets activated by TC co‐stimulation were intravenously injected into zebrafish embryos at 2 dpf and live‐imaged. (a) Left panel shows a simplified schematic of the site of microinjection and the main blood vessels including the ca, cv and cvp along with a representative BF image of the tissue area imaged. Right panel shows an overview of the experimental setup. (b)–(d) Tg(mpeg1:mCherry) embryos were imaged every 20 min from 0.5 to 6.5 hpi. Representative images show the total TC PEV signals (cyan) and macrophages (magenta) at two time points (top panel). The two lower panels display the same images after segmentation by a macrophage‐specific mask (gray) to determine PEV colocalization with macrophage reporters in spatial x‐y‐z dimensions. The panel with the ‘positive mask’ shows only TC PEV signals colocalizing with macrophages, while the ‘negative mask’ panel reveals those that are excluded, such as associations with cells other than macrophages. Scale bar = 20 µm. (c)–(d) Image analysis. trendlines represent individual embryos in light purple (n = 10) with mean ± SEM in dark purple (n = 7, after excluding embryos where macrophages were moving in and out of the field of view). Relative TC PEV sequestration by macrophages (d) is the area ratio of the macrophage‐masked TC PEVs (b, middle panel) to the total TC PEVs (b, top panel). (e) Tg(mpeg1:mCherry) embryos were injected and imaged in a time‐lapse sequence from 3 to 27  mpi with a focus on the interactions of TC PEVs (cyan) with a single macrophage (magenta). Arrows indicate TC PEVs that colocalize with the macrophage reporter. Scale bar = 10 µm. (f) Tg(mpeg1:mCherry); Tg(tnfa:EGFP‐F) embryos at 2 dpf were injected with fluorescently labeled TC PEVs and imaged every 30 min from 1 to 14 hpi. Representative images show transcriptional activation of tumor necrosis factor‐alpha (tnfa, yellow) over time in macrophages (magenta) with or without sequestered TC PEVs (cyan). Arrows indicate examples of macrophages that had sequestered TC PEVs and induced tnfa. Scale bar = 20 µm. Anterior left, dorsal top. BF, bright‐field; ca, caudal artery; cv, caudal vein; cvp, CV plexus; dpf, days post‐fertilization; hpi, hours post‐injection; mpi, minutes post‐injection; PEVs, platelet‐derived extracellular vesicles; TC, thrombin and collagen.

Acknowledgments
This image is the copyrighted work of the attributed author or publisher, and ZFIN has permission only to display this image to its users. Additional permissions should be obtained from the applicable author or publisher of the image. Full text @ J Extracell Vesicles