FIGURE

FIGURE 3

ID
ZDB-FIG-240930-59
Publication
Palviainen et al., 2024 - Beyond basic characterization and omics: Immunomodulatory roles of platelet-derived extracellular vesicles unveiled by functional testing
Other Figures
All Figure Page
Back to All Figure Page
FIGURE 3

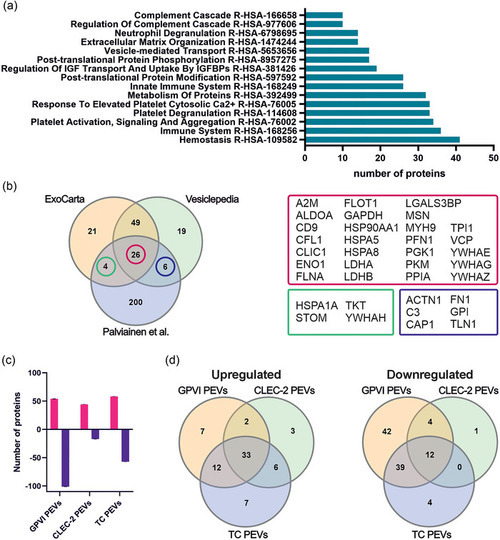
Comparison of the receptor‐induced differences in the protein cargo of PEVs analyzed with mass spectrometry (n = 3; biological replicates representing 12 donors). (a) Bar graph showing the top 15 pathways based on the number of proteins involved in the pathway (≥10, adjusted p‐value ≤ 0.05). (b) Venn diagram comparing the 240 identified proteins, ExoCarta top 100 and Vesiclepedia top 100 proteins reveals 26 proteins shared by the three datasets. In addition, this dataset shares four proteins with the ExoCarta top 100 proteins, and six with the Vesiclepedia top 100 proteins, respectively. (c) Bar graph illustrating the upregulated (red) and downregulated (purple) proteins when the proteomes of the GPVI, CLEC‐2 and TC PEVs were compared to the proteome of the US PEVs. Statistical significance was determined with multiple unpaired t‐tests with Benjamini, Krieger and Yekutieli test correction. (d) Venn diagrams of upregulated and downregulated proteins in the GPVI, CLEC‐2 and TC PEVs in comparison to the US PEVs. PEVs, platelet‐derived extracellular vesicles.

Expression Data

Expression Detail
Antibody Labeling
Phenotype Data

Phenotype Detail
Acknowledgments
This image is the copyrighted work of the attributed author or publisher, and ZFIN has permission only to display this image to its users. Additional permissions should be obtained from the applicable author or publisher of the image. Full text @ J Extracell Vesicles