
- Title
-
The innate immune regulator MyD88 dampens fibrosis during zebrafish heart regeneration
- Authors
- Goumenaki, P., Günther, S., Kikhi, K., Looso, M., Marín-Juez, R., Stainier, D.Y.R.
- Source
- Full text @ Nat Cardiovasc Res
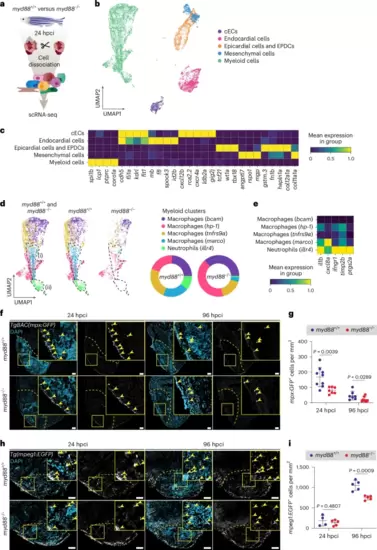
Reduced numbers of pro-inflammatory cells in cryoinjured myd88−/− ventricles.a, Experimental plan for the scRNA-seq analysis performed in cryoinjured myd88+/+ and myd88−/− ventricles at 24 hpci. b, Uniform manifold approximation and projection (UMAP) representation of the scRNA-seq clustering results. c, Heatmap showing the expression levels of the gene markers for the different cell types. d, UMAP representation of the myeloid subclusters from the scRNA-seq analysis. Areas (i) and (ii) enclose myeloid populations reduced in myd88−/− ventricles. The pie charts show the proportions of different myeloid subclusters. e, Heatmap showing inflammatory gene (il1b, cxcl8a, ifngr1, timp2b, ptgs2a) expression levels in the myeloid subclusters. f, Representative images of GFP (neutrophils, white), with DAPI (DNA marker, blue) counterstaining on sections of cryoinjured TgBAC(mpx:GFP); myd88+/+ and TgBAC(mpx:GFP); myd88−/− ventricles at 24 and 96 hpci. GFP; immunostaining for green fluorescent protein. g, mpx:GFP+ cell numbers in myd88+/+ and myd88−/− injured tissues and border zone areas (100 μm) at 24 and 96 hpci. The dots in the graph represent individual ventricles; data are shown as the mean ± s.d.; n = 9 myd88+/+ and n = 7 myd88−/− for 24 hpci; n = 7 myd88+/+ and n = 8 myd88−/− for 96 hpci. Statistical tests: Student’s t-test for 24 hpci and Mann–Whitney U-test for 96 hpci. h, Representative images of immunostaining for EGFP (macrophages, white) with DAPI (DNA marker, blue) counterstaining on sections of cryoinjured Tg(mpeg1:EGFP); myd88+/+ and Tg(mpeg1:EGFP); myd88−/− ventricles at 24 and 96 hpci. i, mpeg1:EGFP+ cell numbers in myd88+/+ and myd88−/− injured tissues and border zone areas (100 μm) at 24 and 96 hpci. The dots in the graph represent individual ventricles; data are shown as the mean ± s.d.; n = 4 myd88+/+ and n = 5 myd88−/− for 24 hpci; n = 5 myd88+/+ and n = 5 myd88−/− for 96 hpci. Statistical tests: Student’s t-test. The yellow dashed lines delineate the injured area; the yellow arrowheads point to mpx:GFP+ (f) and mpeg1:EGFP+ (h) cells. Scale bars, 100 μm. |
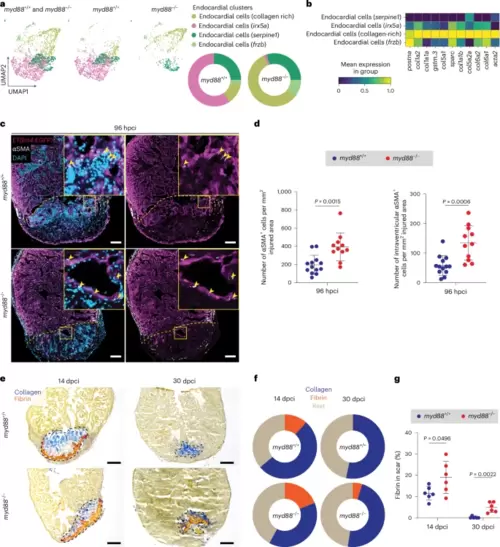
Fibrotic phenotype in cryoinjured myd88−/− ventricles.a, UMAP representation of the endocardial subclusters from the scRNA-seq analysis. The pie charts show the proportions of different endocardial subclusters. b, Heatmap showing fibrotic gene (postna, col1a2, col1a1a, gstm.3, col5a1, sparc, col1a1b, col5a2a, col6a2, col6a1, acta2) expression levels in the endocardial subclusters. c, Representative images of immunostaining for EGFP (endocardial cells, magenta) and αSMA (myofibroblasts, white) with DAPI (DNA marker, blue) counterstaining on sections of cryoinjured ET(krt4:EGFP); myd88+/+ and ET(krt4:EGFP); myd88−/− ventricles at 96 hpci. d, Total number of αSMA+ cells and intraventricular αSMA+ cells in myd88+/+ and myd88−/− injured tissues at 96 hpci. The dots in the graphs represent individual ventricles; data are shown as the mean ± s.d.; n = 13 myd88+/+ and n = 11 myd88−/−. Statistical tests: Student’s t-test. e, Representative images of AFOG staining on sections of cryoinjured myd88+/+ and myd88−/− ventricles at 14 and 30 dpci. f, Pie charts showing the proportion of scar components (collagen, blue; fibrin, red; rest of cells and tissue, light brown) in myd88+/+ and myd88−/− scars; n = 6 myd88+/+ and n = 6 myd88−/− for both 14 and 30 dpci. g, Graph showing the percentage of the fibrin/scar area at 14 and 30 dpci. The dots in the graph represent individual ventricles; data are shown as the mean ± s.d.; n = 6 myd88+/+ and n = 6 myd88−/−. Statistical test: Student’s t-test. The yellow dashed lines delineate the injured area and the black dashed lines the scar area; the yellow arrowheads point to αSMA+ cells. Scale bars, 100 μm (c), 200 μm (e). |
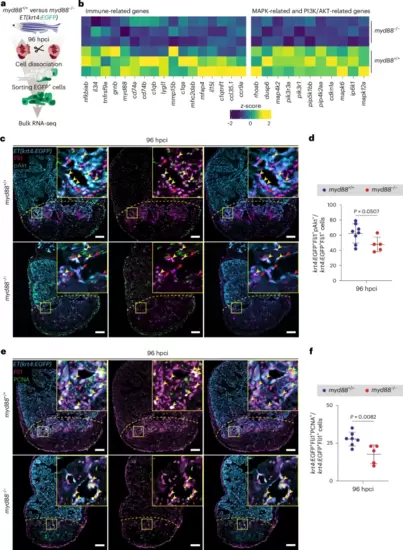
The PI3K/AKT signaling pathway is suppressed in the myd88−/− endocardium.a, Experimental plan for bulk RNA-seq analysis on sorted endocardial cells from ET(krt4:EGFP); myd88+/+ and ET(krt4:EGFP); myd88−/− ventricles at 96 hpci. b, Heatmap showing differential expression of significantly (P < 0.05) downregulated genes in the myd88−/− endocardium at 96 hpci. c, Representative images of immunostaining for EGFP (endocardial cells, blue), Fli1 (endothelial cell nuclei, magenta) and pAkt (phosphoAkt, green) on sections of cryoinjured ET(krt4:EGFP); myd88+/+ and ET(krt4:EGFP); myd88−/− ventricles at 96 hpci. d, krt4:EGFP+Fli1+pAkt+/krt4:EGFP+Fli1+ cell percentage in myd88+/+ and myd88−/− 50-μm-wide areas on the basal-most side of the injured tissue at 96 hpci. The dots in the graph represent individual ventricles; data are shown as the mean ± s.d.; n = 8 myd88+/+ and n = 5 myd88−/−. Statistical test: Student’s t-test. e, Representative images of immunostaining for EGFP (endocardial cells, blue), Fli1 (endothelial cell nuclei, magenta) and PCNA (proliferation marker, green) on sections of cryoinjured ET(krt4:EGFP); myd88+/+ and ET(krt4:EGFP); myd88−/− ventricles at 96 hpci. f, krt4:EGFP+Fli1+PCNA+/krt4:EGFP+Fli1+ cell percentage in myd88+/+ and myd88−/− 50-μm-wide areas on the basal-most side of the injured tissue at 96 hpci. The dots in the graph represent individual ventricles; data are shown as the mean ± s.d.; n = 7 myd88+/+ and n = 5 myd88−/−. Statistical test: Student’s t-test. The yellow dashed lines delineate the injured area; the yellow arrowheads point to krt4:EGFP+Fli1+pAkt+ (c) and krt4:EGFP+Fli1+PCNA+ (e) cells; the red arrowheads (c) point to krt4:EGFP+Fli1+pAkt− cells. Scale bars, 100 μm. |
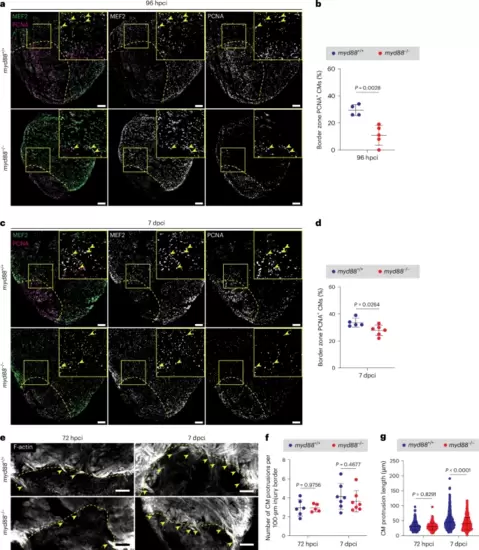
Reduced CM proliferation and reduced length of CM protrusions toward the injured tissue in cryoinjured myd88−/− ventricles.a,c, Representative images of immunostaining for MEF2 (CM nuclei, green) and PCNA (proliferation marker, magenta) on sections of cryoinjured myd88+/+ and myd88−/− ventricles at 96 hpci (a) and 7 dpci (c). b,d, Quantification of proliferating CMs in border zone areas (100 μm) at 96 hpci (b) and 7 dpci (d). The dots in the graphs represent individual ventricles; data are shown as the mean ± s.d.; n = 4 myd88+/+ and n = 5 myd88−/− (b); n = 5 myd88+/+ and n = 6 myd88−/− (d). Statistical tests: Student’s t-test. e, Representative images of phalloidin staining for F-actin (white) on 50-μm-thick sections of cryoinjured myd88+/+ and myd88−/− ventricles at 72 hpci and 7 dpci. f, Quantification of the number of CM protrusions. The dots in the graph represent individual ventricles; data are shown as the mean ± s.d.; n = 6 myd88+/+ and n = 5 myd88−/− for 72 hpci; n = 7 myd88+/+ and n = 7 myd88−/− for 7 dpci. Statistical tests: Student’s t-test. g, Quantification of CM protrusion length. The dots in the graph represent individual CM protrusions; data are shown as the mean ± s.d.; n = 366 myd88+/+ and n = 274 myd88−/− for 72 hpci; n = 633 myd88+/+ and n = 459 myd88−/− for 7 dpci. Statistical tests: Mann–Whitney U-test. The yellow dashed lines delineate the injured area; the yellow arrowheads point to proliferating (a,c) and protruding (e) CMs. Scale bars, 100 μm. |
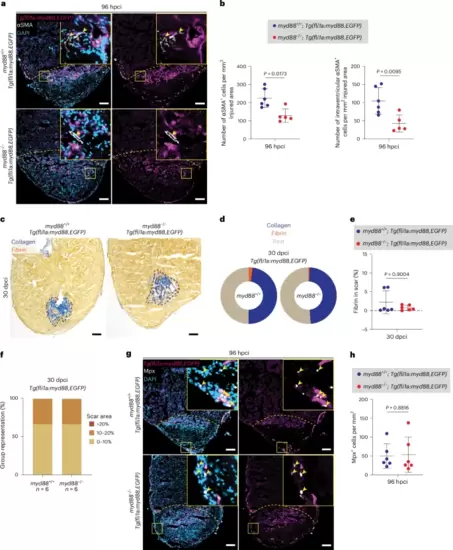
myd88 overexpression in endothelial cells rescues the fibrotic, scarring and neutrophil phenotypes in cryoinjured myd88−/− ventriclesa, Representative images of immunostaining for EGFP (endothelial cells, magenta) and αSMA (myofibroblasts, white) with DAPI (DNA marker, blue) counterstaining on sections of cryoinjured Tg(fli1a:myd88,EGFP); myd88+/+ and Tg(fli1a:myd88,EGFP); myd88−/− ventricles at 96 hpci. b, Total number of αSMA+ cells and of intraventricular αSMA+ cells in Tg(fli1a:myd88,EGFP); myd88+/+ and Tg(fli1a:myd88,EGFP); myd88−/− injured tissues at 96 hpci. The dots in the graphs represent individual ventricles; data are shown as the mean ± s.d.; n = 6 Tg(fli1a:myd88,EGFP); myd88+/+ and n = 5 Tg(fli1a:myd88,EGFP); myd88−/−. Statistical tests: Student’s t-test. c, Representative images of AFOG staining on sections of cryoinjured Tg(fli1a:myd88,EGFP); myd88+/+ and Tg(fli1a:myd88,EGFP); myd88−/− ventricles at 30 dpci. d, Pie charts showing the proportion of scar components (collagen, blue; fibrin, red; rest of cells and tissue, light brown) in Tg(fli1a:myd88,EGFP); myd88+/+ and Tg(fli1a:myd88,EGFP); myd88−/− scars; n = 6 Tg(fli1a:myd88,EGFP); myd88+/+ and n = 6 Tg(fli1a:myd88,EGFP); myd88−/−. e, Graph showing the percentage of fibrin/scar area at 30 dpci. The dots in the graph represent individual ventricles; data are shown as the mean ± s.d.; n = 6 Tg(fli1a:myd88,EGFP); myd88+/+ and n = 6 Tg(fli1a:myd88,EGFP); myd88−/−. Statistical test: Mann–Whitney U-test. f, Graph showing the representation of groups (y axis) of different scar area sizes (different colors) at 30 dpci for cryoinjured Tg(fli1a:myd88,EGFP); myd88+/+ and Tg(fli1a:myd88,EGFP); myd88−/− ventricles. g, Representative images of immunostaining for EGFP (endothelial cells, magenta) and Mpx (neutrophils, white) with DAPI (DNA marker, blue) counterstaining on sections of cryoinjured Tg(fli1a:myd88,EGFP); myd88+/+ and Tg(fli1a:myd88,EGFP); myd88−/− ventricles at 96 hpci. h, Mpx+ cell numbers in Tg(fli1a:myd88,EGFP); myd88+/+ and Tg(fli1a:myd88,EGFP); myd88−/− injured tissues and border zone areas (100 μm) at 96 hpci. The dots in the graph represent individual ventricles; data are shown as the mean ± s.d.; n = 6 Tg(fli1a:myd88,EGFP); myd88+/+ and n = 6 Tg(fli1a:myd88,EGFP); myd88−/−. Statistical test: Student’s t-test. The yellow dashed lines delineate the injured area; the black dashed lines delineate the scar area; the yellow arrowheads point to αSMA+ (a) and Mpx+ (g) cells. Scale bars, 100 μm (a,g), 200 μm (c). |
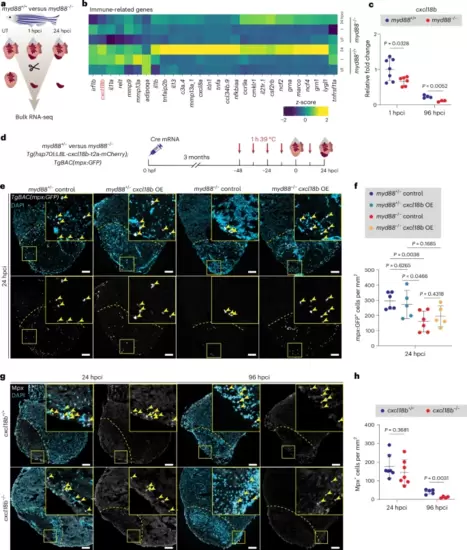
cxcl18b is activated by MyD88 signaling and controls neutrophil recruitment.a, Experimental plan for bulk RNA-seq analysis on myd88+/+ and myd88−/− UT ventricles and injured tissues at 1 and 24 hpci. b, Heatmap showing differential expression of downregulated immune-related genes in myd88−/− UT ventricles and injured tissues at 1 and 24 hpci. c, RT–qPCR analysis of cxcl18b mRNA levels in cryoinjured myd88+/+ and myd88−/− ventricles at 1 and 96 hpci. Data are shown as the mean ± s.d.; n = 7 myd88+/+ and n = 6 myd88−/− for 1 hpci; n = 4 myd88+/+ and n = 3 myd88−/− for 96 hpci. Statistical tests: Student’s t-test. Ct values are listed in Supplementary Table 3. d, Experimental plan for Cre mRNA-injected (cxcl18b overexpression (OE)) or uninjected (control) myd88+/− and Cre mRNA-injected (cxcl18b OE) or uninjected (control) myd88−/− Tg(hsp70l:LBL-cxcl18b-t2a-mCherry); TgBAC(mpx:GFP) siblings at 24 hpci. e, Representative images of immunostaining for GFP (neutrophils, white) with DAPI (DNA marker, blue) counterstaining on sections of cryoinjured myd88+/− control, myd88+/− cxcl18b OE, myd88−/− control and myd88−/− cxcl18b OE TgBAC(mpx:GFP) ventricles at 24 hpci. f, mpx:GFP+ cell numbers in injured tissues and border zone areas (100 μm) at 24 hpci. The dots in the graph represent individual ventricles; data are shown as the mean ± s.d.; n = 6 myd88+/− control, n = 5 myd88+/− cxcl18b OE, n = 6 myd88−/− control and n = 5 myd88−/− cxcl18b OE. Statistical tests: Student’s t-test. g, Representative images of immunostaining for Mpx (neutrophils, white) with DAPI (DNA marker, blue) counterstaining on sections of cryoinjured cxcl18b+/+ and cxcl18b−/− ventricles at 24 and 96 hpci. h, Mpx+ cell numbers in cxcl18b+/+ and cxcl18b−/− injured tissues and border zone areas (100 μm) at 24 and 96 hpci. The dots in the graphs represent individual ventricles; data are shown as the mean ± s.d.; n = 7 cxcl18b+/+ and n = 7 cxcl18b−/− for 24 hpci; n = 5 cxcl18b+/+ and n = 4 cxcl18b−/− for 96 hpci. Statistical tests: Student’s t-test. The yellow dashed lines delineate the injured area; the yellow arrowheads point to mpx:GFP+ (e) and Mpx+ (g) cells. Scale bars, 100 μm. |
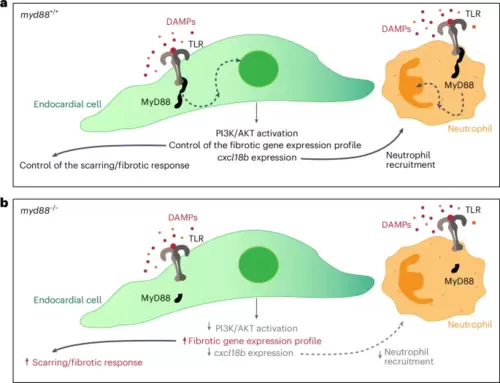
Proposed model for the role of MyD88 in fibrosis and neutrophil recruitment following cardiac cryoinjury in zebrafish.a, TLRs (and IL-1Rs) recruit the adaptor molecule MyD88 upon ligand interaction. MyD88 in turn initiates signal transduction, which leads to the activation of several processes. In endocardial cells, PI3K/AKT pathway activation and fibrosis are controlled by the MyD88 signaling pathway. Neutrophil count is also partially affected by the levels of the endocardial chemokine Cxcl18b. Immune cells also activate a MyD88-mediated response leading to several processes, including the recruitment of more immune cells and the manifestation of an inflammatory response. b, In myd88−/− injured tissues, the MyD88 signaling pathway is not activated and thus, endocardial cells exhibit decreased activation of the PI3K/AKT pathway. myd88−/− injured tissues also exhibit decreased levels of the endocardial chemokine gene cxcl18b and an increase in features related to fibrosis. In addition, the neutrophil count appears significantly reduced. As the fibrotic and the immune responses are affected, other processes essential for successful regeneration are also impaired, including revascularization and CM proliferation. |