
Fig. 2
- ID
- ZDB-FIG-240916-11
- Publication
- Goumenaki et al., 2024 - The innate immune regulator MyD88 dampens fibrosis during zebrafish heart regeneration
- Other Figures
- All Figure Page
- Back to All Figure Page
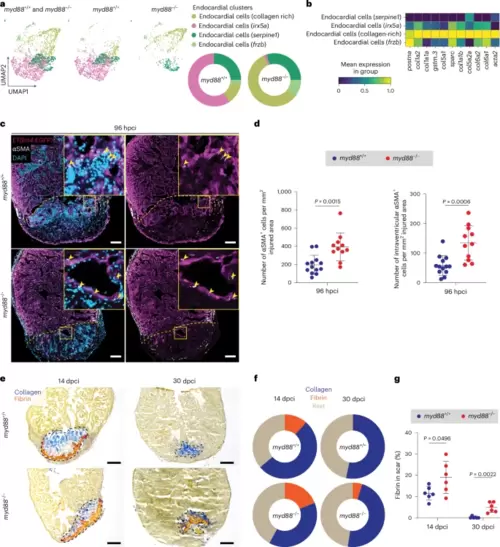
Fibrotic phenotype in cryoinjured myd88−/− ventricles.a, UMAP representation of the endocardial subclusters from the scRNA-seq analysis. The pie charts show the proportions of different endocardial subclusters. b, Heatmap showing fibrotic gene (postna, col1a2, col1a1a, gstm.3, col5a1, sparc, col1a1b, col5a2a, col6a2, col6a1, acta2) expression levels in the endocardial subclusters. c, Representative images of immunostaining for EGFP (endocardial cells, magenta) and αSMA (myofibroblasts, white) with DAPI (DNA marker, blue) counterstaining on sections of cryoinjured ET(krt4:EGFP); myd88+/+ and ET(krt4:EGFP); myd88−/− ventricles at 96 hpci. d, Total number of αSMA+ cells and intraventricular αSMA+ cells in myd88+/+ and myd88−/− injured tissues at 96 hpci. The dots in the graphs represent individual ventricles; data are shown as the mean ± s.d.; n = 13 myd88+/+ and n = 11 myd88−/−. Statistical tests: Student’s t-test. e, Representative images of AFOG staining on sections of cryoinjured myd88+/+ and myd88−/− ventricles at 14 and 30 dpci. f, Pie charts showing the proportion of scar components (collagen, blue; fibrin, red; rest of cells and tissue, light brown) in myd88+/+ and myd88−/− scars; n = 6 myd88+/+ and n = 6 myd88−/− for both 14 and 30 dpci. g, Graph showing the percentage of the fibrin/scar area at 14 and 30 dpci. The dots in the graph represent individual ventricles; data are shown as the mean ± s.d.; n = 6 myd88+/+ and n = 6 myd88−/−. Statistical test: Student’s t-test. The yellow dashed lines delineate the injured area and the black dashed lines the scar area; the yellow arrowheads point to αSMA+ cells. Scale bars, 100 μm (c), 200 μm (e). |