
|
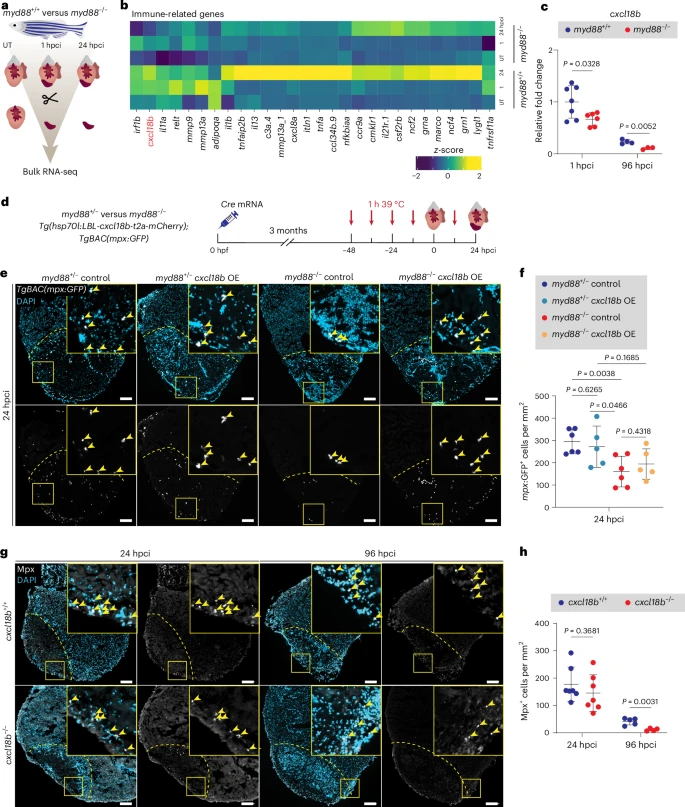
Fig. 6 cxcl18b is activated by MyD88 signaling and controls neutrophil recruitment.a, Experimental plan for bulk RNA-seq analysis on myd88+/+ and myd88−/− UT ventricles and injured tissues at 1 and 24 hpci. b, Heatmap showing differential expression of downregulated immune-related genes in myd88−/− UT ventricles and injured tissues at 1 and 24 hpci. c, RT–qPCR analysis of cxcl18b mRNA levels in cryoinjured myd88+/+ and myd88−/− ventricles at 1 and 96 hpci. Data are shown as the mean ± s.d.; n = 7 myd88+/+ and n = 6 myd88−/− for 1 hpci; n = 4 myd88+/+ and n = 3 myd88−/− for 96 hpci. Statistical tests: Student’s t-test. Ct values are listed in Supplementary Table 3. d, Experimental plan for Cre mRNA-injected (cxcl18b overexpression (OE)) or uninjected (control) myd88+/− and Cre mRNA-injected (cxcl18b OE) or uninjected (control) myd88−/− Tg(hsp70l:LBL-cxcl18b-t2a-mCherry); TgBAC(mpx:GFP) siblings at 24 hpci. e, Representative images of immunostaining for GFP (neutrophils, white) with DAPI (DNA marker, blue) counterstaining on sections of cryoinjured myd88+/− control, myd88+/− cxcl18b OE, myd88−/− control and myd88−/− cxcl18b OE TgBAC(mpx:GFP) ventricles at 24 hpci. f, mpx:GFP+ cell numbers in injured tissues and border zone areas (100 μm) at 24 hpci. The dots in the graph represent individual ventricles; data are shown as the mean ± s.d.; n = 6 myd88+/− control, n = 5 myd88+/− cxcl18b OE, n = 6 myd88−/− control and n = 5 myd88−/− cxcl18b OE. Statistical tests: Student’s t-test. g, Representative images of immunostaining for Mpx (neutrophils, white) with DAPI (DNA marker, blue) counterstaining on sections of cryoinjured cxcl18b+/+ and cxcl18b−/− ventricles at 24 and 96 hpci. h, Mpx+ cell numbers in cxcl18b+/+ and cxcl18b−/− injured tissues and border zone areas (100 μm) at 24 and 96 hpci. The dots in the graphs represent individual ventricles; data are shown as the mean ± s.d.; n = 7 cxcl18b+/+ and n = 7 cxcl18b−/− for 24 hpci; n = 5 cxcl18b+/+ and n = 4 cxcl18b−/− for 96 hpci. Statistical tests: Student’s t-test. The yellow dashed lines delineate the injured area; the yellow arrowheads point to mpx:GFP+ (e) and Mpx+ (g) cells. Scale bars, 100 μm.