
|
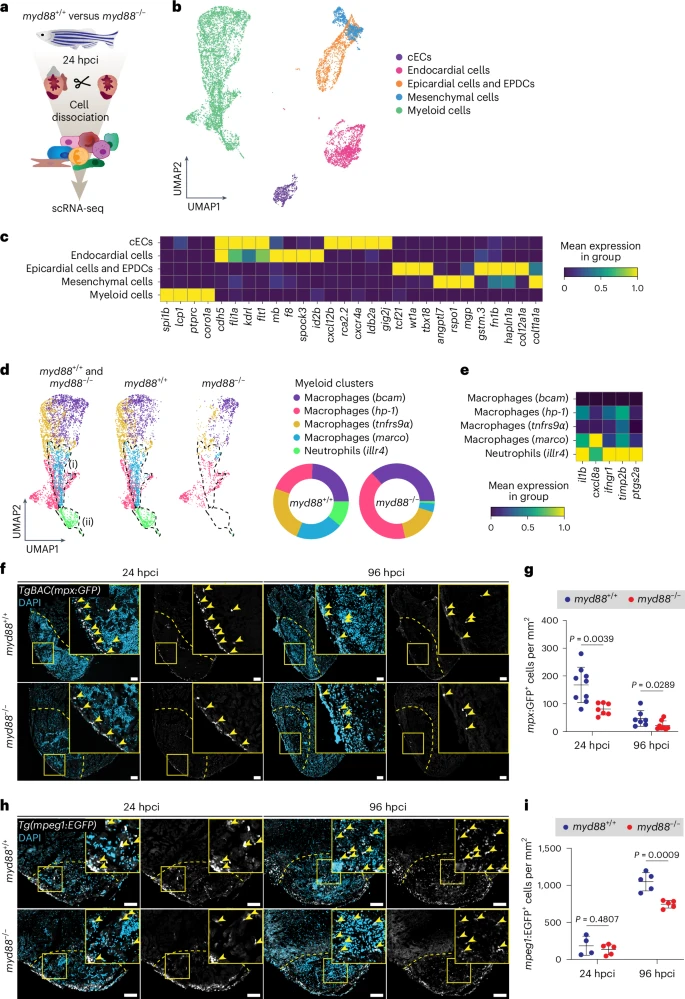
Fig. 1 Reduced numbers of pro-inflammatory cells in cryoinjured myd88−/− ventricles.a, Experimental plan for the scRNA-seq analysis performed in cryoinjured myd88+/+ and myd88−/− ventricles at 24 hpci. b, Uniform manifold approximation and projection (UMAP) representation of the scRNA-seq clustering results. c, Heatmap showing the expression levels of the gene markers for the different cell types. d, UMAP representation of the myeloid subclusters from the scRNA-seq analysis. Areas (i) and (ii) enclose myeloid populations reduced in myd88−/− ventricles. The pie charts show the proportions of different myeloid subclusters. e, Heatmap showing inflammatory gene (il1b, cxcl8a, ifngr1, timp2b, ptgs2a) expression levels in the myeloid subclusters. f, Representative images of GFP (neutrophils, white), with DAPI (DNA marker, blue) counterstaining on sections of cryoinjured TgBAC(mpx:GFP); myd88+/+ and TgBAC(mpx:GFP); myd88−/− ventricles at 24 and 96 hpci. GFP; immunostaining for green fluorescent protein. g, mpx:GFP+ cell numbers in myd88+/+ and myd88−/− injured tissues and border zone areas (100 μm) at 24 and 96 hpci. The dots in the graph represent individual ventricles; data are shown as the mean ± s.d.; n = 9 myd88+/+ and n = 7 myd88−/− for 24 hpci; n = 7 myd88+/+ and n = 8 myd88−/− for 96 hpci. Statistical tests: Student’s t-test for 24 hpci and Mann–Whitney U-test for 96 hpci. h, Representative images of immunostaining for EGFP (macrophages, white) with DAPI (DNA marker, blue) counterstaining on sections of cryoinjured Tg(mpeg1:EGFP); myd88+/+ and Tg(mpeg1:EGFP); myd88−/− ventricles at 24 and 96 hpci. i, mpeg1:EGFP+ cell numbers in myd88+/+ and myd88−/− injured tissues and border zone areas (100 μm) at 24 and 96 hpci. The dots in the graph represent individual ventricles; data are shown as the mean ± s.d.; n = 4 myd88+/+ and n = 5 myd88−/− for 24 hpci; n = 5 myd88+/+ and n = 5 myd88−/− for 96 hpci. Statistical tests: Student’s t-test. The yellow dashed lines delineate the injured area; the yellow arrowheads point to mpx:GFP+ (f) and mpeg1:EGFP+ (h) cells. Scale bars, 100 μm.