
Fig. 4
- ID
- ZDB-FIG-240916-13
- Publication
- Goumenaki et al., 2024 - The innate immune regulator MyD88 dampens fibrosis during zebrafish heart regeneration
- Other Figures
- All Figure Page
- Back to All Figure Page
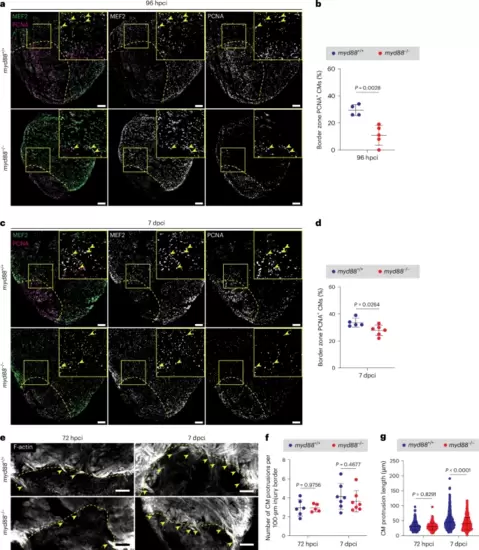
Reduced CM proliferation and reduced length of CM protrusions toward the injured tissue in cryoinjured myd88−/− ventricles.a,c, Representative images of immunostaining for MEF2 (CM nuclei, green) and PCNA (proliferation marker, magenta) on sections of cryoinjured myd88+/+ and myd88−/− ventricles at 96 hpci (a) and 7 dpci (c). b,d, Quantification of proliferating CMs in border zone areas (100 μm) at 96 hpci (b) and 7 dpci (d). The dots in the graphs represent individual ventricles; data are shown as the mean ± s.d.; n = 4 myd88+/+ and n = 5 myd88−/− (b); n = 5 myd88+/+ and n = 6 myd88−/− (d). Statistical tests: Student’s t-test. e, Representative images of phalloidin staining for F-actin (white) on 50-μm-thick sections of cryoinjured myd88+/+ and myd88−/− ventricles at 72 hpci and 7 dpci. f, Quantification of the number of CM protrusions. The dots in the graph represent individual ventricles; data are shown as the mean ± s.d.; n = 6 myd88+/+ and n = 5 myd88−/− for 72 hpci; n = 7 myd88+/+ and n = 7 myd88−/− for 7 dpci. Statistical tests: Student’s t-test. g, Quantification of CM protrusion length. The dots in the graph represent individual CM protrusions; data are shown as the mean ± s.d.; n = 366 myd88+/+ and n = 274 myd88−/− for 72 hpci; n = 633 myd88+/+ and n = 459 myd88−/− for 7 dpci. Statistical tests: Mann–Whitney U-test. The yellow dashed lines delineate the injured area; the yellow arrowheads point to proliferating (a,c) and protruding (e) CMs. Scale bars, 100 μm. |