
Fig. 5
- ID
- ZDB-FIG-240916-14
- Publication
- Goumenaki et al., 2024 - The innate immune regulator MyD88 dampens fibrosis during zebrafish heart regeneration
- Other Figures
- All Figure Page
- Back to All Figure Page
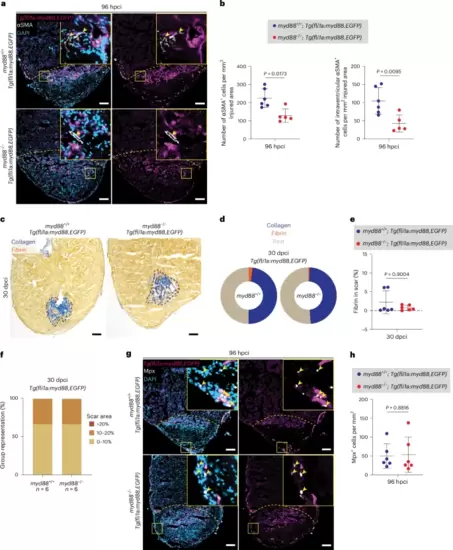
myd88 overexpression in endothelial cells rescues the fibrotic, scarring and neutrophil phenotypes in cryoinjured myd88−/− ventriclesa, Representative images of immunostaining for EGFP (endothelial cells, magenta) and αSMA (myofibroblasts, white) with DAPI (DNA marker, blue) counterstaining on sections of cryoinjured Tg(fli1a:myd88,EGFP); myd88+/+ and Tg(fli1a:myd88,EGFP); myd88−/− ventricles at 96 hpci. b, Total number of αSMA+ cells and of intraventricular αSMA+ cells in Tg(fli1a:myd88,EGFP); myd88+/+ and Tg(fli1a:myd88,EGFP); myd88−/− injured tissues at 96 hpci. The dots in the graphs represent individual ventricles; data are shown as the mean ± s.d.; n = 6 Tg(fli1a:myd88,EGFP); myd88+/+ and n = 5 Tg(fli1a:myd88,EGFP); myd88−/−. Statistical tests: Student’s t-test. c, Representative images of AFOG staining on sections of cryoinjured Tg(fli1a:myd88,EGFP); myd88+/+ and Tg(fli1a:myd88,EGFP); myd88−/− ventricles at 30 dpci. d, Pie charts showing the proportion of scar components (collagen, blue; fibrin, red; rest of cells and tissue, light brown) in Tg(fli1a:myd88,EGFP); myd88+/+ and Tg(fli1a:myd88,EGFP); myd88−/− scars; n = 6 Tg(fli1a:myd88,EGFP); myd88+/+ and n = 6 Tg(fli1a:myd88,EGFP); myd88−/−. e, Graph showing the percentage of fibrin/scar area at 30 dpci. The dots in the graph represent individual ventricles; data are shown as the mean ± s.d.; n = 6 Tg(fli1a:myd88,EGFP); myd88+/+ and n = 6 Tg(fli1a:myd88,EGFP); myd88−/−. Statistical test: Mann–Whitney U-test. f, Graph showing the representation of groups (y axis) of different scar area sizes (different colors) at 30 dpci for cryoinjured Tg(fli1a:myd88,EGFP); myd88+/+ and Tg(fli1a:myd88,EGFP); myd88−/− ventricles. g, Representative images of immunostaining for EGFP (endothelial cells, magenta) and Mpx (neutrophils, white) with DAPI (DNA marker, blue) counterstaining on sections of cryoinjured Tg(fli1a:myd88,EGFP); myd88+/+ and Tg(fli1a:myd88,EGFP); myd88−/− ventricles at 96 hpci. h, Mpx+ cell numbers in Tg(fli1a:myd88,EGFP); myd88+/+ and Tg(fli1a:myd88,EGFP); myd88−/− injured tissues and border zone areas (100 μm) at 96 hpci. The dots in the graph represent individual ventricles; data are shown as the mean ± s.d.; n = 6 Tg(fli1a:myd88,EGFP); myd88+/+ and n = 6 Tg(fli1a:myd88,EGFP); myd88−/−. Statistical test: Student’s t-test. The yellow dashed lines delineate the injured area; the black dashed lines delineate the scar area; the yellow arrowheads point to αSMA+ (a) and Mpx+ (g) cells. Scale bars, 100 μm (a,g), 200 μm (c). |