
- Title
-
Targeting EGLN2/PHD1 protects motor neurons and normalizes the astrocytic interferon response
- Authors
- Germeys, C., Vandoorne, T., Davie, K., Poovathingal, S., Heeren, K., Vermeire, W., Nami, F., Moisse, M., Quaegebeur, A., Sierksma, A., Rué, L., Sicart, A., Eykens, C., De Cock, L., De Strooper, B., Carmeliet, P., Van Damme, P., De Bock, K., Van Den Bosch, L.
- Source
- Full text @ Cell Rep.
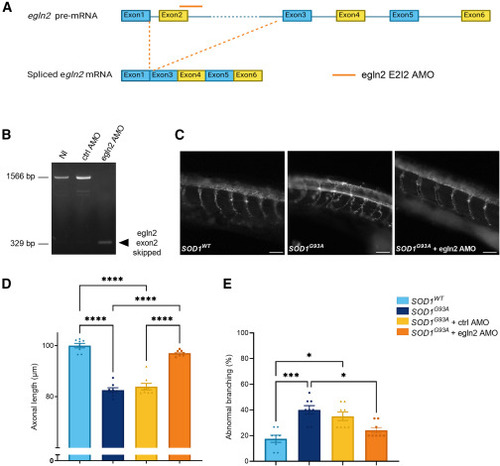
Egln2 downregulation rescues motor axonopathy in SOD1G93A zebrafish (A) Schematic representation of the splice-block antisense oligonucleotide morpholino (AMO) that targets the exon 2-intron 2 (E2I2) junction in zebrafish egln2 pre-mRNA, resulting in a differentially spliced egln2. (B) Validation of the AMO-induced splice defect using RT-PCR. Wild-type (WT) egln2 cDNA in 30 h post-fertilization (hpf) non-injected (NI) and control (ctrl) AMO or alternative splice product induced by E2I2 splice-blocking AMO, indicated by the arrowhead. (C) Representative images of synaptic vesicle glycoprotein 2a (SV2) staining at 30 hpf in zebrafish injected with SOD1WT RNA, SOD1G93A RNA, and SOD1G93A RNA with egln2 AMO. Scale bar, 50 μm. (D) Quantification of the axonal length. (E) Quantification of the percentage of abnormally branched axons. Data represent mean ± SEM with individual values shown (N = 8 experiments, each with 15 zebrafish per group). Statistical analyses were performed in (D) by a one-way ANOVA with Sidak’s multiple comparison test and in (E) with the Kruskal-Wallis test with Dunn’s multiple comparison test (∗p < 0.05, ∗∗∗p < 0.001, and ∗∗∗∗p < 0.0001). |
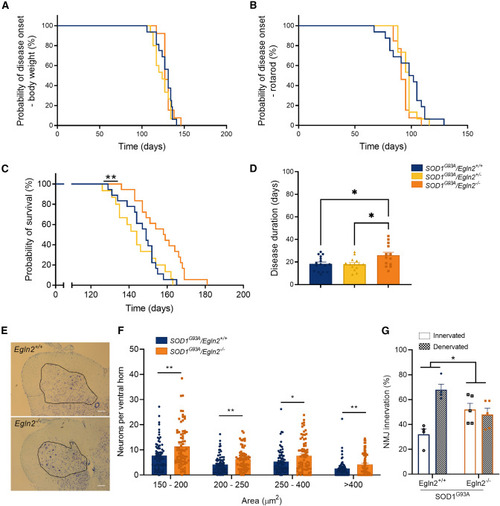
Egln2 deletion prolongs survival and mitigates motor neuron degeneration in SOD1G93A mice (A) Probability of disease onset assessed by a body weight reduction of 10%. SOD1G93A/Egln2+/+ N = 16, SOD1G93A/Egln2+/− N = 15, and SOD1G93A/Egln2−/− N = 13. (B) Probability of disease onset assessed by a reduction of the performance time on the rotarod below 150 s. SOD1G93A/Egln2+/+ N = 16, SOD1G93A/Egln2+/− N = 15, and SOD1G93A/Egln2−/− N = 13. (C) Probability of survival; humane endpoint defined as loss of righting reflex within 20 s. SOD1G93A/Egln2+/+ N = 18, SOD1G93A/Egln2+/− N = 15, and SOD1G93A/Egln2−/− N = 18. (D) Disease duration defined as days between disease onset and humane endpoint. SOD1G93A/Egln2+/+ N = 16, SOD1G93A/Egln2+/− N = 15, and SOD1G93A/Egln2−/− N = 13. (E) Representative thionin staining of neurons in the lumbar spinal cord of SOD1G93A/Egln2+/+ and SOD1G93A/Egln2−/− mice at P110. Ventral horn indicated in black. Scale bar, 150 μm. (F) Quantification of number of neurons in the ventral horn of SOD1G93A/Egln2+/+ and SOD1G93A/Egln2−/− mice normalized to 300,000 μm2 of ventral horn and categorized per size. (G) Percentages of innervated and denervated neuromuscular junctions (NMJs) in SOD1G93A/Egln2+/+ and SOD1G93A/Egln2−/− mice at P110. Data represent mean ± SEM with individual values shown (N ≥ 4 mice per group). Statistical analyses were performed in (A)–(C) by log-rank Mantel-Cox, in (D) by a one-way ANOVA with Tukey’s multiple comparison, in (F) by a two-way ANOVA with Sidak’s multiple comparison test, and in (G) by an unpaired t test (∗p < 0.05 and ∗∗p < 0.01). |
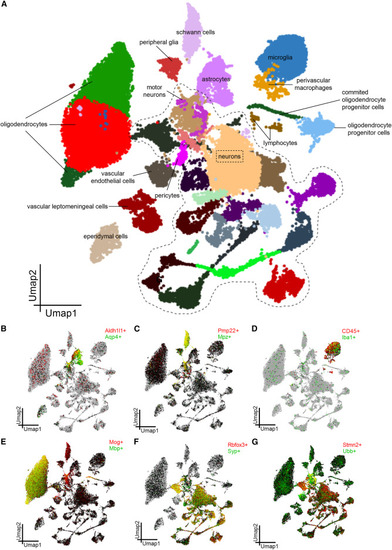
Single-nucleus transcriptomics reveals neuronal and non-neuronal cell clusters in SOD1G93A spinal cord (A) Uniform manifold approximation and projection (UMAP) plot visualizing 42,278 nuclei isolated from the lumbar spinal cord of P110 SOD1G93A/Egln2+/+ and SOD1G93A/Egln2−/− mice. SOD1G93A/Egln2+/+ N = 3 and SOD1G93A/Egln2−/− N = 3. The annotation of different clusters is based on publicly available transcriptomics data. (B–G) Individual nuclei colored by expression for classical markers for (B) astrocytes, (C) Schwann cells, (D) microglia, (E) myelinating oligodendrocytes, (F) neurons, and (G) motor neurons using SCope. |
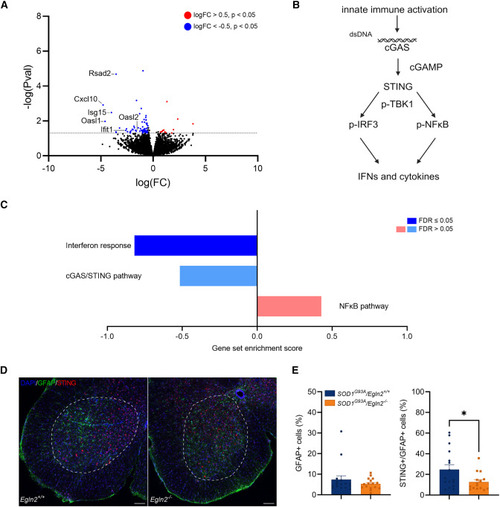
Egln2 deletion induces astrocyte-specific downregulation of interferon-stimulated genes (A) Volcano plot showing all DEGs in astrocytes from SOD1G93A/Egln2−/− versus SOD1G93A/Egln2+/+ lumbar spinal cord at P110. Red indicates significant genes with upregulated expression (log10 (fold change) [log(FC)] > 0.5) in SOD1G93A/Egln2−/− versus SOD1G93A/Egln2+/+ mice, and blue indicates significant genes with downregulated expression (log(FC) < −0.5) in SOD1G93A/Egln2−/− versus SOD1G93A/Egln2+/+ mice. (B) Graphical representation of the cGAS/STING and NF-κB pathways. (C) Gene set enrichment analysis (GSEA) scores for interferon response, 55 cGAS/STING pathway, 56 and NF-κB pathway 55 in DEGs from SOD1G93A/Egln2−/− versus SOD1G93A/Egln2+/+ astrocytes. (D) Representative images of immunohistochemical analysis of 4′,6-diamidino-2-phenylindole (DAPI), glial fibrillary acidic protein (GFAP), and STING in the lumbar spinal cord ventral horn, indicated with a white dotted line, of SOD1G93A/Egln2+/+ and SOD1G93A/Egln2−/− mice at P110. Scale bar, 50 μm. (E) Quantification of number of GFAP-positive (GFAP+) cells and STING- and GFAP-positive (STING+/GFAP+) cells. Data represent mean ± SEM, with the individual values of each lumbar spinal cord section shown (N ≥ 4 mice per group). Statistical analyses were performed by an unpaired t test (∗p < 0.05). |
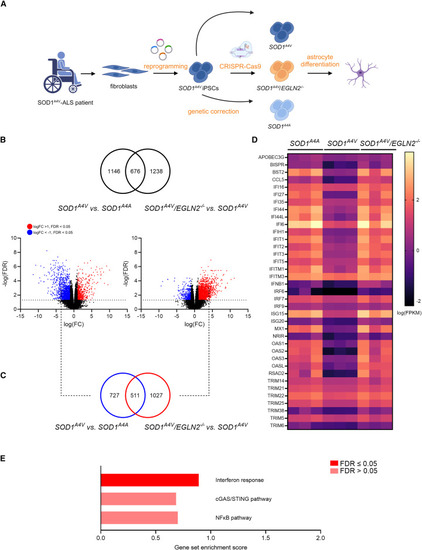
EGLN2 deletion restores the level of interferon-stimulated genes in SOD1A4V patient-derived astrocytes (A) Schematic representation of the experimental setup. (B) Venn diagram demonstrating the overlap between all significant DEGs in SOD1A4V versus SOD1A4A astrocytes (left volcano plot) and all significant DEGs in SOD1A4V/EGLN2−/− versus SOD1A4V astrocytes (right volcano plot). Red indicates significant upregulated genes (log(FC) > 1), and blue indicates significant downregulated genes (log(FC) < −1). (C) Venn diagram showing the overlap between the significantly downregulated genes in SOD1A4V versus SOD1A4A astrocytes (log(FC) < −1) and significantly upregulated genes in SOD1A4V/EGLN2−/− versus SOD1A4V astrocytes (log(FC) > 1). (D) Heatmap showing the expression levels (fragments per kilobase million [FPKM]) of interferon-stimulated genes in SOD1A4A, SOD1A4V, and SOD1A4V/EGLN2−/− astrocytes. (E) GSEA scores for interferon response, 55 cGAS/STING pathway, 56 and NF-κB pathway 55 in DEGs from in SOD1A4V/EGLN2−/− versus SOD1A4V astrocytes. N = 3 astrocyte differentiations. |
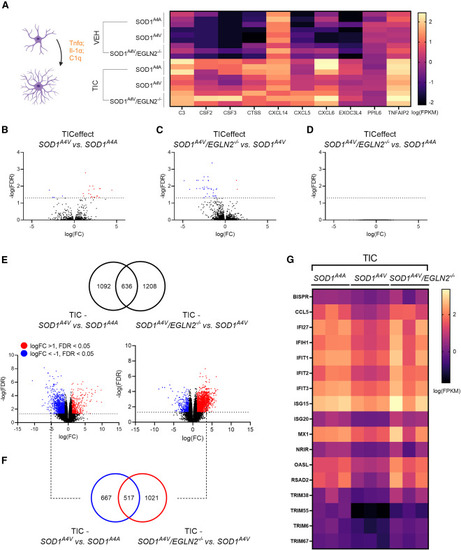
EGLN2 deletion restores the levels of interferon-stimulated genes in reactive SOD1A4V patient-derived astrocytes (A) Heatmap showing the expression levels (FPKM) of reactive astrocyte marker genes in SOD1A4A, SOD1A4V, and SOD1A4V/EGLN2−/− astrocytes treated with vehicle (VEH) or TNF-α, IL-1α, and C1q (TIC). (B–D) Volcano plot showing all genes that respond differently to the TIC treatment in (B) SOD1A4V versus SOD1A4A astrocytes, (C) SOD1A4V/EGLN2−/− versus SOD1A4V astrocytes, and (D) SOD1A4V/EGLN2−/− versus SOD1A4A astrocytes. Red indicates significant upregulated genes (log(FC) > 1), and blue indicates significant downregulated genes (log(FC) < −1). (E) Venn diagram showing the overlap between all significant DEGs in SOD1A4V versus SOD1A4A TIC-treated astrocytes (left volcano plot) and all significant DEGs in SOD1A4V/EGLN2−/− versus SOD1A4V TIC-treated astrocytes (right volcano plot). (F) Venn diagram showing the overlap between the significantly downregulated genes in SOD1A4V versus SOD1A4A TIC-treated astrocytes (log(FC) < −1) and significantly upregulated genes in SOD1A4V/EGLN2−/− versus SOD1A4V TIC-treated astrocytes (log(FC) > 1). (G) Heatmap showing the expression levels (FPKM) of interferon-stimulated genes in SOD1A4A, SOD1A4V, and SOD1A4V/EGLN2−/− TIC-treated astrocytes. N = 3 astrocyte differentiations. |