
Fig. 4
- ID
- ZDB-FIG-241007-22
- Publication
- Germeys et al., 2024 - Targeting EGLN2/PHD1 protects motor neurons and normalizes the astrocytic interferon response
- Other Figures
- All Figure Page
- Back to All Figure Page
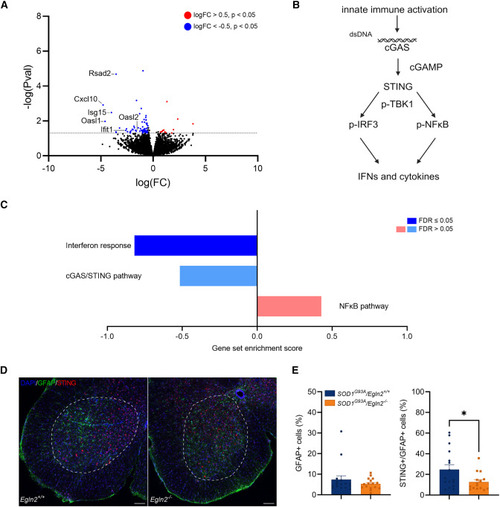
Egln2 deletion induces astrocyte-specific downregulation of interferon-stimulated genes (A) Volcano plot showing all DEGs in astrocytes from SOD1G93A/Egln2−/− versus SOD1G93A/Egln2+/+ lumbar spinal cord at P110. Red indicates significant genes with upregulated expression (log10 (fold change) [log(FC)] > 0.5) in SOD1G93A/Egln2−/− versus SOD1G93A/Egln2+/+ mice, and blue indicates significant genes with downregulated expression (log(FC) < −0.5) in SOD1G93A/Egln2−/− versus SOD1G93A/Egln2+/+ mice. (B) Graphical representation of the cGAS/STING and NF-κB pathways. (C) Gene set enrichment analysis (GSEA) scores for interferon response, 55 cGAS/STING pathway, 56 and NF-κB pathway 55 in DEGs from SOD1G93A/Egln2−/− versus SOD1G93A/Egln2+/+ astrocytes. (D) Representative images of immunohistochemical analysis of 4′,6-diamidino-2-phenylindole (DAPI), glial fibrillary acidic protein (GFAP), and STING in the lumbar spinal cord ventral horn, indicated with a white dotted line, of SOD1G93A/Egln2+/+ and SOD1G93A/Egln2−/− mice at P110. Scale bar, 50 μm. (E) Quantification of number of GFAP-positive (GFAP+) cells and STING- and GFAP-positive (STING+/GFAP+) cells. Data represent mean ± SEM, with the individual values of each lumbar spinal cord section shown (N ≥ 4 mice per group). Statistical analyses were performed by an unpaired t test (∗p < 0.05). |