
|
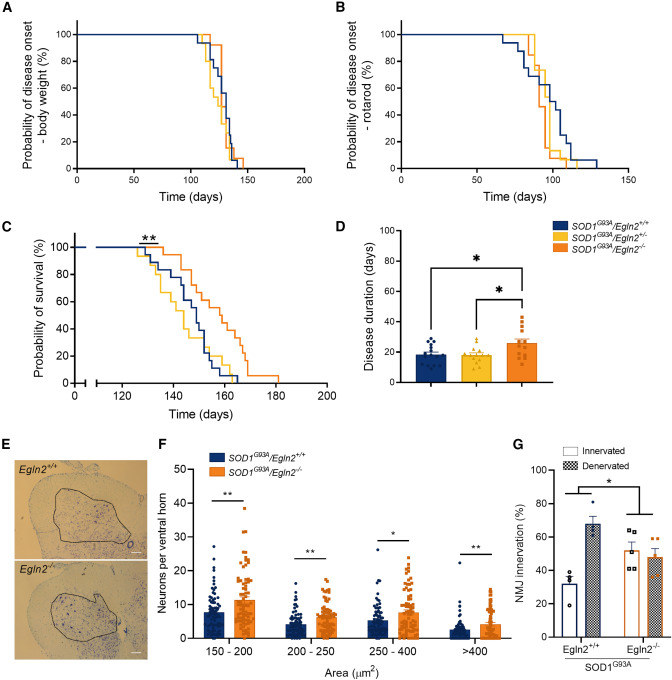
Fig. 2 Egln2 deletion prolongs survival and mitigates motor neuron degeneration in SOD1G93A mice (A) Probability of disease onset assessed by a body weight reduction of 10%. SOD1G93A/Egln2+/+ N = 16, SOD1G93A/Egln2+/− N = 15, and SOD1G93A/Egln2−/− N = 13. (B) Probability of disease onset assessed by a reduction of the performance time on the rotarod below 150 s. SOD1G93A/Egln2+/+ N = 16, SOD1G93A/Egln2+/− N = 15, and SOD1G93A/Egln2−/− N = 13. (C) Probability of survival; humane endpoint defined as loss of righting reflex within 20 s. SOD1G93A/Egln2+/+ N = 18, SOD1G93A/Egln2+/− N = 15, and SOD1G93A/Egln2−/− N = 18. (D) Disease duration defined as days between disease onset and humane endpoint. SOD1G93A/Egln2+/+ N = 16, SOD1G93A/Egln2+/− N = 15, and SOD1G93A/Egln2−/− N = 13. (E) Representative thionin staining of neurons in the lumbar spinal cord of SOD1G93A/Egln2+/+ and SOD1G93A/Egln2−/− mice at P110. Ventral horn indicated in black. Scale bar, 150 μm. (F) Quantification of number of neurons in the ventral horn of SOD1G93A/Egln2+/+ and SOD1G93A/Egln2−/− mice normalized to 300,000 μm2 of ventral horn and categorized per size. (G) Percentages of innervated and denervated neuromuscular junctions (NMJs) in SOD1G93A/Egln2+/+ and SOD1G93A/Egln2−/− mice at P110. Data represent mean ± SEM with individual values shown (N ≥ 4 mice per group). Statistical analyses were performed in (A)–(C) by log-rank Mantel-Cox, in (D) by a one-way ANOVA with Tukey’s multiple comparison, in (F) by a two-way ANOVA with Sidak’s multiple comparison test, and in (G) by an unpaired t test (∗p < 0.05 and ∗∗p < 0.01).