
|
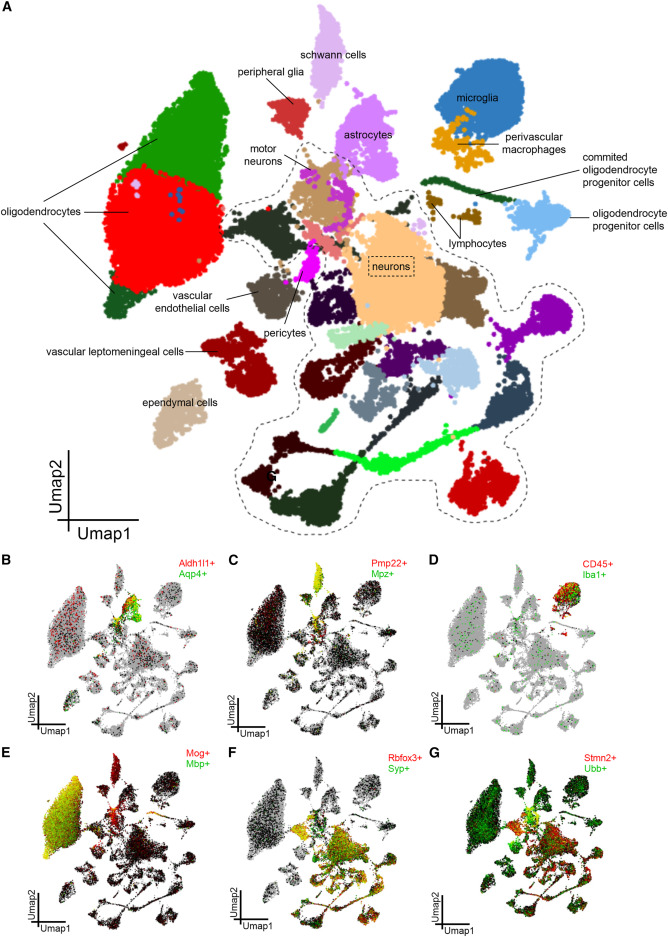
Fig. 3 Single-nucleus transcriptomics reveals neuronal and non-neuronal cell clusters in SOD1G93A spinal cord (A) Uniform manifold approximation and projection (UMAP) plot visualizing 42,278 nuclei isolated from the lumbar spinal cord of P110 SOD1G93A/Egln2+/+ and SOD1G93A/Egln2−/− mice. SOD1G93A/Egln2+/+ N = 3 and SOD1G93A/Egln2−/− N = 3. The annotation of different clusters is based on publicly available transcriptomics data. (B–G) Individual nuclei colored by expression for classical markers for (B) astrocytes, (C) Schwann cells, (D) microglia, (E) myelinating oligodendrocytes, (F) neurons, and (G) motor neurons using SCope.