
Fig. 5
- ID
- ZDB-FIG-241007-23
- Publication
- Germeys et al., 2024 - Targeting EGLN2/PHD1 protects motor neurons and normalizes the astrocytic interferon response
- Other Figures
- All Figure Page
- Back to All Figure Page
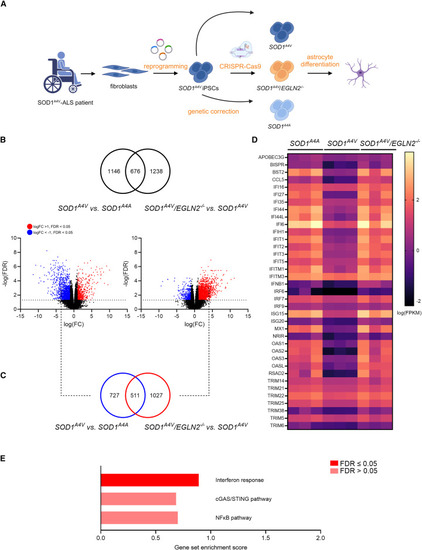
EGLN2 deletion restores the level of interferon-stimulated genes in SOD1A4V patient-derived astrocytes (A) Schematic representation of the experimental setup. (B) Venn diagram demonstrating the overlap between all significant DEGs in SOD1A4V versus SOD1A4A astrocytes (left volcano plot) and all significant DEGs in SOD1A4V/EGLN2−/− versus SOD1A4V astrocytes (right volcano plot). Red indicates significant upregulated genes (log(FC) > 1), and blue indicates significant downregulated genes (log(FC) < −1). (C) Venn diagram showing the overlap between the significantly downregulated genes in SOD1A4V versus SOD1A4A astrocytes (log(FC) < −1) and significantly upregulated genes in SOD1A4V/EGLN2−/− versus SOD1A4V astrocytes (log(FC) > 1). (D) Heatmap showing the expression levels (fragments per kilobase million [FPKM]) of interferon-stimulated genes in SOD1A4A, SOD1A4V, and SOD1A4V/EGLN2−/− astrocytes. (E) GSEA scores for interferon response, 55 cGAS/STING pathway, 56 and NF-κB pathway 55 in DEGs from in SOD1A4V/EGLN2−/− versus SOD1A4V astrocytes. N = 3 astrocyte differentiations. |