
Fig. 6
- ID
- ZDB-FIG-241007-24
- Publication
- Germeys et al., 2024 - Targeting EGLN2/PHD1 protects motor neurons and normalizes the astrocytic interferon response
- Other Figures
- All Figure Page
- Back to All Figure Page
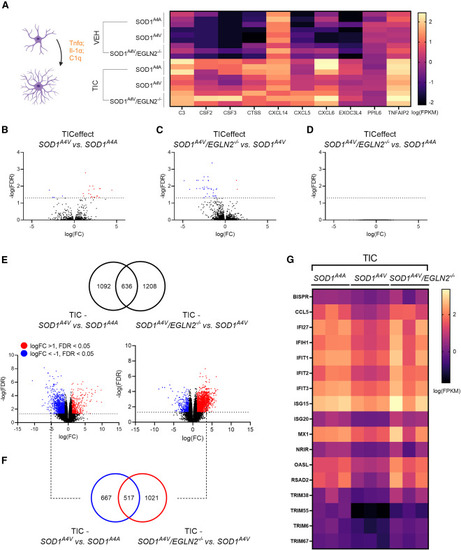
EGLN2 deletion restores the levels of interferon-stimulated genes in reactive SOD1A4V patient-derived astrocytes (A) Heatmap showing the expression levels (FPKM) of reactive astrocyte marker genes in SOD1A4A, SOD1A4V, and SOD1A4V/EGLN2−/− astrocytes treated with vehicle (VEH) or TNF-α, IL-1α, and C1q (TIC). (B–D) Volcano plot showing all genes that respond differently to the TIC treatment in (B) SOD1A4V versus SOD1A4A astrocytes, (C) SOD1A4V/EGLN2−/− versus SOD1A4V astrocytes, and (D) SOD1A4V/EGLN2−/− versus SOD1A4A astrocytes. Red indicates significant upregulated genes (log(FC) > 1), and blue indicates significant downregulated genes (log(FC) < −1). (E) Venn diagram showing the overlap between all significant DEGs in SOD1A4V versus SOD1A4A TIC-treated astrocytes (left volcano plot) and all significant DEGs in SOD1A4V/EGLN2−/− versus SOD1A4V TIC-treated astrocytes (right volcano plot). (F) Venn diagram showing the overlap between the significantly downregulated genes in SOD1A4V versus SOD1A4A TIC-treated astrocytes (log(FC) < −1) and significantly upregulated genes in SOD1A4V/EGLN2−/− versus SOD1A4V TIC-treated astrocytes (log(FC) > 1). (G) Heatmap showing the expression levels (FPKM) of interferon-stimulated genes in SOD1A4A, SOD1A4V, and SOD1A4V/EGLN2−/− TIC-treated astrocytes. N = 3 astrocyte differentiations. |