
- Title
-
Acute indomethacin exposure impairs cardiac development by affecting cardiac muscle contraction and inducing myocardial apoptosis in zebrafish (Danio rerio)
- Authors
- Liu, Y., Shi, X., Lu, C., Kou, G., Wu, X., Meng, X., Lv, Y., Luo, J., Cui, W., Yang, X.
- Source
- Full text @ Ecotoxicol. Environ. Saf.
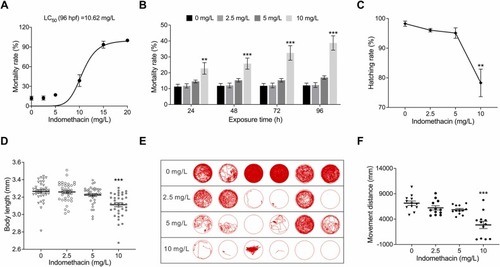
The developmental toxicity of indomethacin exposure in zebrafish embryos. (A) Determination of the median lethal concentration of indomethacin in zebrafish embryos after 96 h of exposure (n = 100 for each group). (B) The mortality rates of zebrafish embryos treated with indomethacin at different concentrations for 24–96 h (n = 100 for each group). (C) The hatching rate of zebrafish embryos exposed to indomethacin for 72 h (n = 100 for each group). (D) Determination of the body length of zebrafish embryos treated with different concentrations of indomethacin after 96 h of indomethacin exposure (n = 36 for each group). (E, F) Representative images and quantification of moving track graphs (E) and swimming distances (F) of zebrafish embryos treated with indomethacin at different concentrations for 96 h (n = 12 for each group). All values are presented as the mean ± SEM. **P < 0.01, ***P < 0.001. |
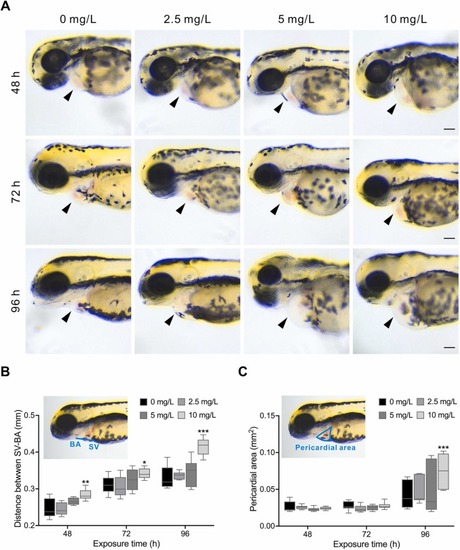
Indomethacin exposure impairs cardiac development in zebrafish embryos. (A) Representative optical images of pericardial oedema in zebrafish embryos after exposure to indomethacin at 48, 72 and 96 h. Arrowheads, the pericardial areas. Scale bars, 200 µm. (B) Representative image (upper panel) and quantification (lower panel) of the distances between the venous sinus and bulbus arteriosus (SV-BA) of zebrafish embryos exposed to various concentrations of indomethacin for 48–96 h (n = 9 for each group). (C) Representative image (upper panel) and quantification (lower panel) of pericardial areas in zebrafish embryos treated with different concentrations of indomethacin for 48–96 h (n = 15 for each group). All the values are presented as the means ± SEM. *P < 0.05, **P < 0.01, ***P < 0.001. |
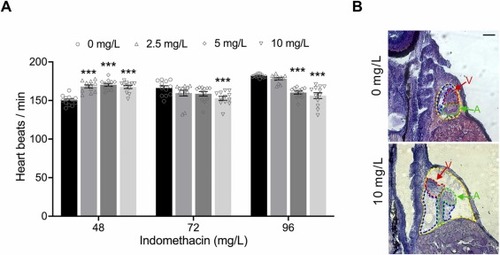
Indomethacin exposure results in the aberrant heart rate and cardiac morpholog in zebrafish embryos. (A) Quantification of heart rates in zebrafish embryos treated with different concentrations of indomethacin for 48–96 h (n = 12 for each group). (B) Representative images of H&E-stained zebrafish embryos after exposure to of indomethacin at 96 h (n = 9 for each group). Yellow circles represent pericardial areas, red dotted circles represent ventricle areas (V), and green dotted circles represent atrium areas (A), blue dotted circles represent myocardial layers. Scale bar, 200 µm. All the values are presented as the means ± SEM. ***P < 0.001. |
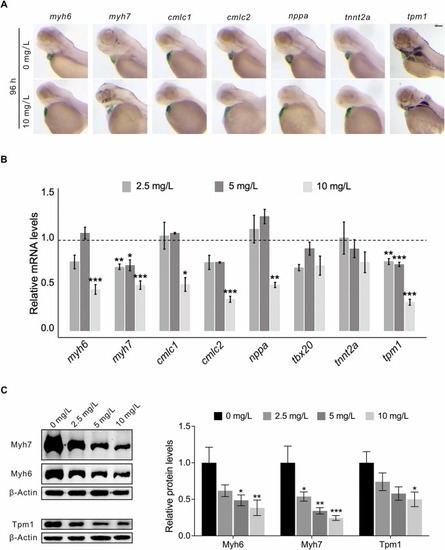
Indomethacin exposure induces the regulation of cardiac development-related genes in zebrafish embryos. (A) The representative images of several key cardiac development-related genes in cardiac regions of zebrafish embryos using WISH assay after 96 h indomethacin exposure. (B) The determination of mRNA levels of cardiac development-related genes in zebrafish embryos treated with different concentrations of indomethacin after 96 h of exposure using qPCR assay. Broken line indicates the relative expression levels of target gene in control groups. (C) Western blotting analysis of Myh6, Myh7, and Tpm1 expression in zebrafish embryos treated with different concentrations of indomethacin for 96 h (n = 100 for each group). All the experiments were performed independently with three biological replicates. All the values are presented as the means ± SEM. *P < 0.05, **P < 0.01, ***P < 0.001. |

The regulation of the cardiac muscle contraction signaling pathway is associated with indomethacin-induced cardiac disruption in zebrafish embryos. (A) Schematic diagram of cardiac muscle contraction and the key associated regulators. (B) Heatmap analysis of cardiac muscle contraction and the calcium signaling pathway in zebrafish embryos treated with different concentrations of indomethacin after 72 and 96 h of exposure. The pink grid represents upregulated genes, and the green grid represents downregulated genes. All the experiments were performed independently with three biological replicates. |
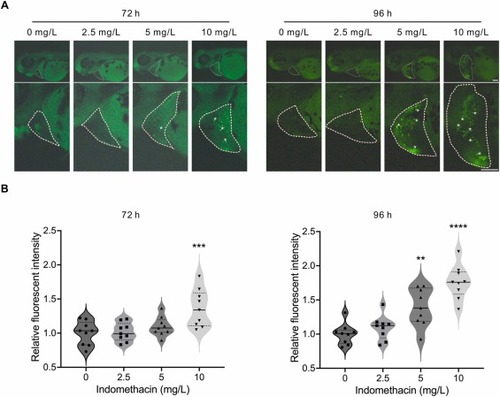
Indomethacin exposure induces myocardial apoptosis in zebrafish embryos. (A) Representative fluorescence images of the apoptotic phenotype of zebrafish treated with indomethacin at different concentrations after 72 and 96 h of exposure. The white dotted circles represent pericardial areas, and the asterisks represent apoptotic cells. Scale bar, 200 µm. (B) Quantification of fluorescent intensities in the pericardial areas of zebrafish embryos treated with indomethacin at different concentrations after 72 and 96 h of exposure (n = 9 for each group). All the values are presented as the means ± SEM. **P < 0.01, ***P < 0.001, ****P < 0.0001. |