
|
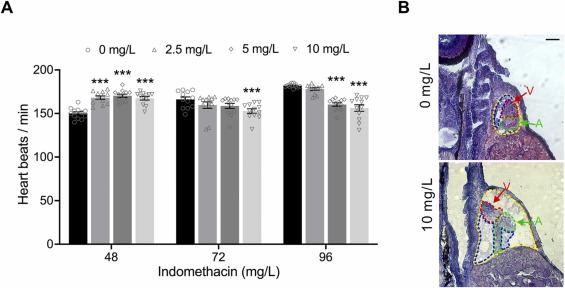
Fig. 3 Indomethacin exposure results in the aberrant heart rate and cardiac morpholog in zebrafish embryos. (A) Quantification of heart rates in zebrafish embryos treated with different concentrations of indomethacin for 48–96 h (n = 12 for each group). (B) Representative images of H&E-stained zebrafish embryos after exposure to of indomethacin at 96 h (n = 9 for each group). Yellow circles represent pericardial areas, red dotted circles represent ventricle areas (V), and green dotted circles represent atrium areas (A), blue dotted circles represent myocardial layers. Scale bar, 200 µm. All the values are presented as the means ± SEM. ***P < 0.001.