
- Title
-
Activation of Nrf2 at Critical Windows of Development Alters Tissue-Specific Protein S-Glutathionylation in the Zebrafish (Danio rerio) Embryo
- Authors
- Marques, E.S., Severance, E.G., Arsenault, P., Zahn, S.M., Timme-Laragy, A.R.
- Source
- Full text @ Antioxidants (Basel)

( |

( |

Zebrafish were treated with 40 µM SFN or 1 µM tBHQ during the protruding-mouth stage for 6 h and then fixed, and Nrf2a protein was labeled using immunohistochemistry (IHC). Liver images were acquired using confocal microscopy. ( |

Zebrafish were treated with 40 µM SFN or 1 µM tBHQ during the pharyngula, hatching, and protruding-mouth stages for 6 h and then fixed, and Nrf2a protein was labeled using immunohistochemistry (IHC). Colocalization analysis was performed on 40× confocal images of the liver, and a representative image of the pancreatic islet was taken from the Z-stack. Pearson’s R coefficients were converted to normally distributed Z-scores, shown as means ± SEMs, where higher Z-scores indicate greater colocalization between Nrf2a protein and nuclear DAPI staining within the region of interest. Significance was assessed with a two-way or three-way ANOVA followed by Fisher’s LSD post hoc test. |

( |
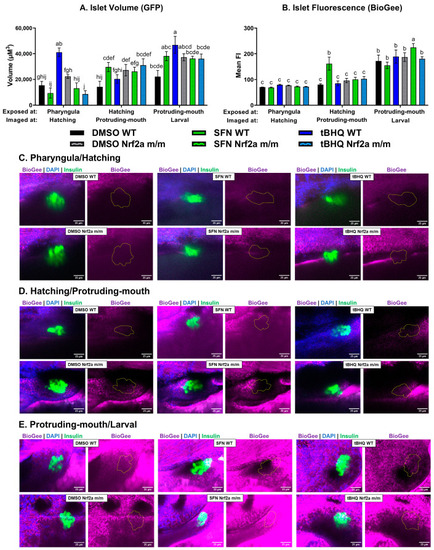
Zebrafish were treated with 40 µM SFN or 1 µM tBHQ for 6 h during the pharyngula, hatching, and protruding-mouth stages and incubated with BioGee for 2 h before fixation 24 h after the start of the exposure. BioGee protein conjugates were labeled in situ using IHC. Confocal microscopy was used to acquire Z-stacks of the islet. ( |

Zebrafish were treated with 40 µM SFN or 1 µM tBHQ during the hatching and protruding-mouth stages for 6 h and incubated with BioGee for 2 h before fixation 24 h after treatment. BioGee protein conjugates were labeled in situ using IHC. Confocal microscopy was used to acquire images of the liver using a 40× objective. ( |
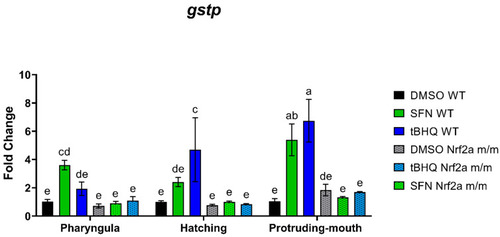
Zebrafish were treated with 40 µM SFN or 1 µM tBHQ for 6 h during the pharyngula, hatching, and protruding-mouth stages and then collected for gene expression via quantitative real-time PCR. mRNA expression was measured for |