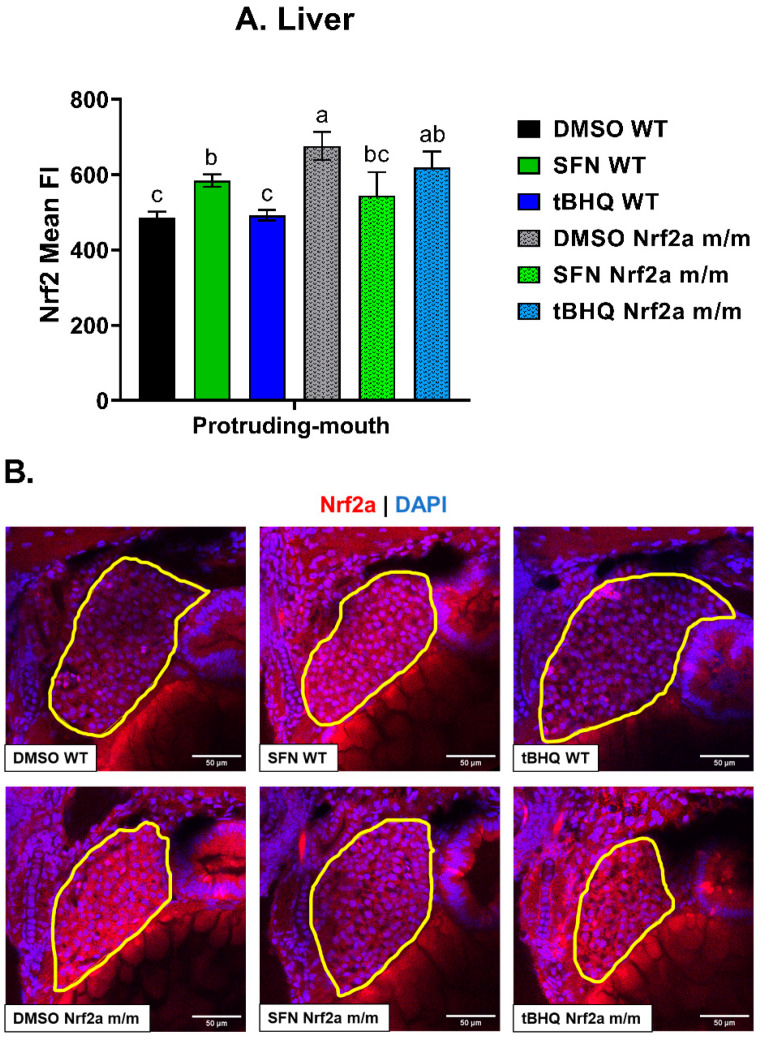
IMAGE

Figure 3

ID
ZDB-IMAGE-240902-12
Source
Figures for Marques et al., 2024
Image
Figure Caption

Figure 3

Zebrafish were treated with 40 µM SFN or 1 µM tBHQ during the protruding-mouth stage for 6 h and then fixed, and Nrf2a protein was labeled using immunohistochemistry (IHC). Liver images were acquired using confocal microscopy. (A) The mean fluorescence intensity (FI) of labeled Nrf2a protein in the liver was quantified via image analysis. (B) Representative images of the zebrafish liver are shown, where the liver is outlined in yellow, TRITC (red) represents Nrf2a, and DAPI (blue) represents nuclei. Statistics were performed using a one-way ANOVA followed by Fisher’s LSD post hoc test. n = 8–13 fish. Letters indicate significant differences (p ≤ 0.05). Scale bar = 50 µm.

Acknowledgments
This image is the copyrighted work of the attributed author or publisher, and ZFIN has permission only to display this image to its users. Additional permissions should be obtained from the applicable author or publisher of the image. Full text @ Antioxidants (Basel)