IMAGE

Figure 8

ID
ZDB-IMAGE-240902-19
Source
Figures for Marques et al., 2024
Image
Figure Caption

Figure 8

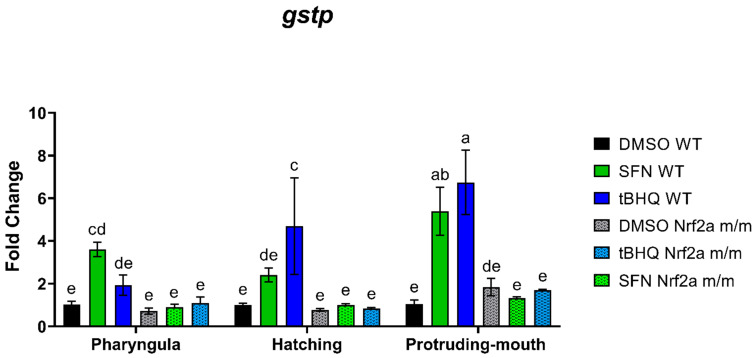
Zebrafish were treated with 40 µM SFN or 1 µM tBHQ for 6 h during the pharyngula, hatching, and protruding-mouth stages and then collected for gene expression via quantitative real-time PCR. mRNA expression was measured for glutathione S-transferase Pi (gstp) along with the housekeeping gene β2-Microglobulin (b2m). The ΔΔCT method was used to calculate fold change. Values are mean fold change ± SEM. Statistical significance was assessed via two-way ANOVA followed by Fisher’s LSD post hoc test. n = 2–3 pools of 15–20 (hatching and protruding-mouth stages) or 20–40 (pharyngula) fish. Different letters indicate significant differences (p ≤ 0.05) among groups.

Acknowledgments
This image is the copyrighted work of the attributed author or publisher, and ZFIN has permission only to display this image to its users. Additional permissions should be obtained from the applicable author or publisher of the image. Full text @ Antioxidants (Basel)