
- Title
-
mTORC1 mediates the expansion of hematopoietic stem and progenitor cells through ribosome biogenesis protein Urb2 in zebrafish
- Authors
- Huang, W., Yue, Y., Hao, W., Zhang, Z., Cai, P., Yang, D.
- Source
- Full text @ Stem Cell Reports
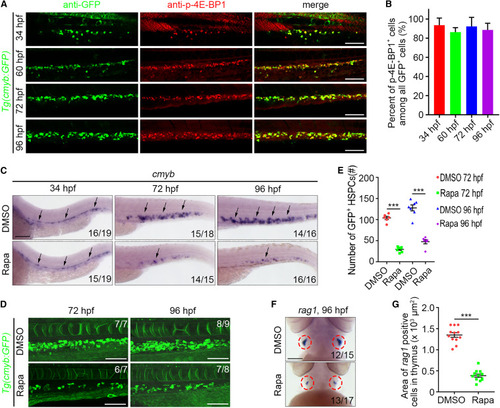
mTORC1 signaling is required for HSPC development in zebrafish (A) Single-optical section images showing GFP and p-4E-BP1 antibody staining under Tg(cmyb:GFP) background at 34 , 60 , 72 , and 96 hpf. (B) Quantification of the percent of p-4E-BP1+ cells among all GFP+ cells. (C) WISH images showing the cmyb expression at 34 , 72 , and 96 hpf. Arrows indicate AGM at 34 hpf and CHT at 72 and 96 hpf. (D) Confocal projection images showing the cmyb:GFP expression in CHT at 72 and 96 hpf. (E) Quantification of the number of GFP+ HSPCs. ∗∗∗p < 0.001 on unpaired two-tailed t test (n = number of total embryos from three independent experiments). (F) WISH images showing the rag1 expression at 96 hpf. (G) Quantification of the area of rag1+ cells in the thymus. Circles indicate the thymus. ∗∗∗p < 0.001 on unpaired two-tailed t test (n = number of total embryos from three independent experiments). Error bars represent SEM. Scale bars: 100 μm. Rapa, rapamycin. |
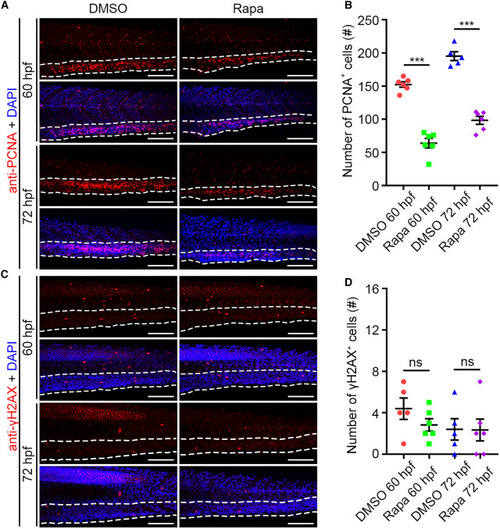
mTORC1 inhibition leads to compromised proliferation but normal apoptosis in the CHT region (A) Confocal projection images showing PCNA antibody and DAPI stainings at 60 and 72 hpf. (B) Quantification of the number of PCNA+ cells in the CHT. ∗∗∗p < 0.001 on unpaired two-tailed t test (n = 6 embryos from three independent experiments). (C) Confocal projection images showing γH2AX antibody and DAPI stainings at 60 and 72 hpf. (D) Quantification of the number of γH2AX+ cells in the CHT. ns, no significant difference (n = 6 embryos from three independent experiments). Error bars represent SEM. White dashed lines mark the CHT region. Scale bars: 100 μm. Rapa, rapamycin. |
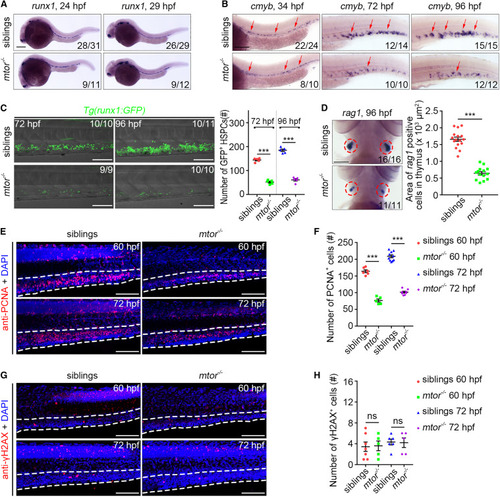
The mtor mutant exhibits defective HSPC expansion (A) WISH images showing the runx1 expression in siblings and mtor mutants at 24 and 29 hpf. (B) WISH images showing the cmyb expression in siblings and mtor mutants at 34, 72, and 96 hpf. Arrows indicate AGM at 34 hpf and CHT at 72 and 96 hpf. (C) Confocal projection images showing the runx1:GFP expression in CHT at 72 and 96 hpf. Quantification of the number of GFP+ HSPCs. ∗∗∗p < 0.001 on unpaired two-tailed t test (n = number of total embryos from three independent experiments). (D) WISH images showing the rag1 expression at 96 hpf. Circles indicate the thymus. Quantification of the area of rag1+ cells in the thymus. ∗∗∗p < 0.001 on unpaired two-tailed t test (n = number of total embryos from three independent experiments). (E) Confocal projection images showing PCNA antibody and DAPI stainings in siblings and mtor mutants at 60 and 72 hpf. (F) Quantification of the number of PCNA+ cells in the CHT. ∗∗∗p < 0.001 on unpaired two-tailed t test (n = 10 embryos from three independent experiments). (G) Confocal projection images showing γH2AX antibody and DAPI stainings at 60 and 72 hpf. (H) Quantification of the number of γH2AX+ cells in the CHT. ns, no significant difference (n = 7 embryos from three independent experiments). Error bars represent SEM. White dashed lines mark the CHT region. Scale bars: 100 μm. |
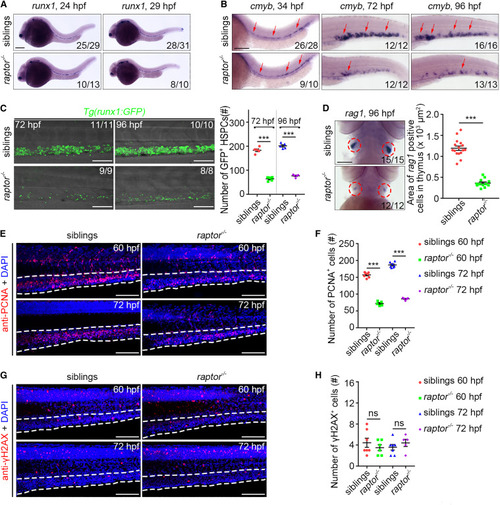
The raptor mutant exhibits defective HSPC expansion (A) WISH images showing the runx1 expression in siblings and raptor mutants at 24 and 29 hpf. (B) WISH images showing the cmyb expression in siblings and raptor mutants at 34, 72, and 96 hpf. Arrows indicate AGM at 34 hpf and CHT at 72 and 96 hpf. (C) Confocal projection images showing the runx1:GFP expression in CHT at 72 and 96 hpf. Quantification of the number of GFP+ HSPCs. ∗∗∗p < 0.001 on unpaired two-tailed t test (n = number of total embryos from three independent experiments). (D) WISH images showing the rag1 expression at 96 hpf. Circles indicate the thymus. Quantification of the area of rag1+ cells in the thymus. ∗∗∗p < 0.001 on unpaired two-tailed t test (n = number of total embryos from three independent experiments). (E) Confocal projection images showing PCNA antibody and DAPI stainings in siblings and raptor mutants at 60 and 72 hpf. (F) Quantification of the number of PCNA+ cells in the CHT. ∗∗∗p < 0.001 on unpaired two-tailed t test (n = 7 embryos from three independent experiments). (G) Confocal projection images showing γH2AX antibody and DAPI stainings at 60 and 72 hpf. (H) Quantification of the number of γH2AX+ cells in the CHT. ns, no significant difference (n = 7 embryos from three independent experiments). Error bars represent SEM. White dashed lines mark the CHT region. Scale bars: 100 μm. |
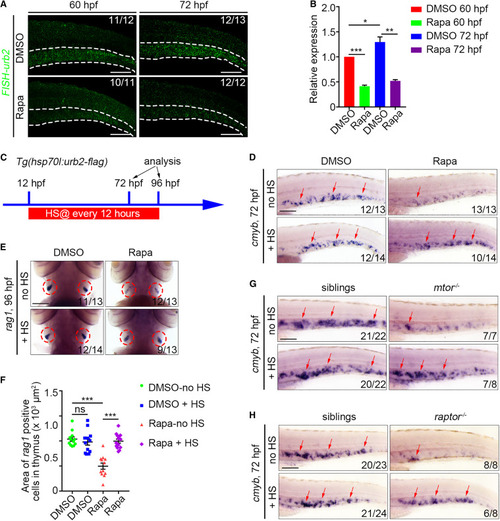
Urb2 acts as a downstream effector of mTORC1 to regulate HSPC expansion (A) FISH images showing the urb2 expression in DMSO- or rapamycin-treated embryos at 60 and 72 hpf. White dashed lines mark the CHT region. (B) qPCR data showing the relative expression level of urb2 in the CHT at 60 and 72 hpf. ∗p < 0.05, ∗∗p < 0.01, ∗∗∗p < 0.001 on unpaired two-tailed t test (three independent experiments, with >20 embryos pooled per condition, per experiment). (C) Experimental scheme illustrating the heat-shocked condition. (D) WISH images showing the cmyb expression after urb2 overexpression in DMSO- and rapamycin-treated groups at 72 hpf. (E) WISH images showing the rag1 expression after urb2 overexpression in DMSO- and rapamycin-treated groups at 96 hpf. Circles indicate the thymus. (F) Quantification of the area of rag1+ cells in the thymus. ns, no significant difference. ∗∗∗p < 0.001 on unpaired two-tailed t test (n = number of total embryos from three independent experiments). (G and H) WISH images showing the cmyb expression after urb2 overexpression in the mtor mutant (G) and raptor mutant (H) at 72 hpf. Error bars represent SEM. Scale bars: 100 μm. Rapa, rapamycin; HS, heat shock. |
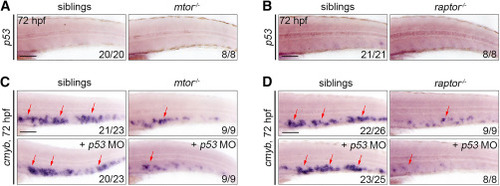
mTORC1 regulates HSPC expansion in a P53-independent way (A) WISH images showing the p53 expression in siblings and mtor mutants at 72 hpf. (B) WISH images showing the p53 expression at 72 hpf in siblings and raptor mutants. (C) WISH images showing the cmyb expression in siblings and mtor mutants after p53 morpholino injection at 72 hpf. (D) WISH images showing the cmyb expression in siblings and raptor mutants after p53 morpholino injection at 72 hpf. Scale bars: 100 μm. Arrows indicate the CHT region. MO, morpholino. |