
Fig. 2
- ID
- ZDB-IMAGE-240912-53
- Antibodies
- Publication
- Huang et al., 2024 - mTORC1 mediates the expansion of hematopoietic stem and progenitor cells through ribosome biogenesis protein Urb2 in zebrafish
- All Figures
- Figures for Huang et al., 2024
|
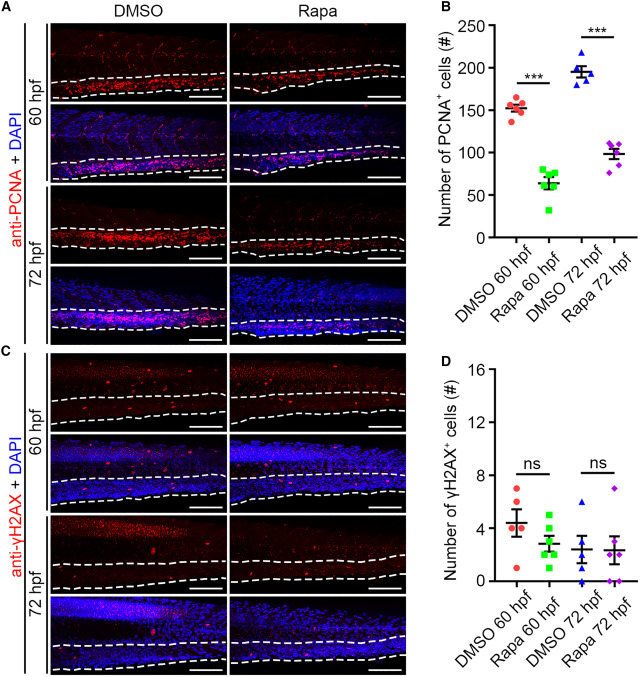
Fig. 2 mTORC1 inhibition leads to compromised proliferation but normal apoptosis in the CHT region (A) Confocal projection images showing PCNA antibody and DAPI stainings at 60 and 72 hpf. (B) Quantification of the number of PCNA+ cells in the CHT. ∗∗∗p < 0.001 on unpaired two-tailed t test (n = 6 embryos from three independent experiments). (C) Confocal projection images showing γH2AX antibody and DAPI stainings at 60 and 72 hpf. (D) Quantification of the number of γH2AX+ cells in the CHT. ns, no significant difference (n = 6 embryos from three independent experiments). Error bars represent SEM. White dashed lines mark the CHT region. Scale bars: 100 μm. Rapa, rapamycin.