
IMAGE
Fig. 6
- ID
- ZDB-IMAGE-240912-57
- Genes
- Publication
- Huang et al., 2024 - mTORC1 mediates the expansion of hematopoietic stem and progenitor cells through ribosome biogenesis protein Urb2 in zebrafish
- All Figures
- Figures for Huang et al., 2024
Image
|
Figure Caption
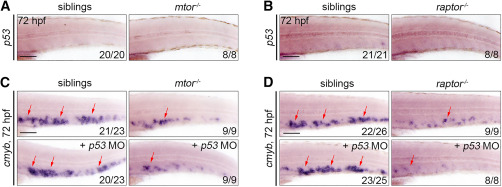
Fig. 6 mTORC1 regulates HSPC expansion in a P53-independent way (A) WISH images showing the p53 expression in siblings and mtor mutants at 72 hpf. (B) WISH images showing the p53 expression at 72 hpf in siblings and raptor mutants. (C) WISH images showing the cmyb expression in siblings and mtor mutants after p53 morpholino injection at 72 hpf. (D) WISH images showing the cmyb expression in siblings and raptor mutants after p53 morpholino injection at 72 hpf. Scale bars: 100 μm. Arrows indicate the CHT region. MO, morpholino.
Figure Data
Acknowledgments
This image is the copyrighted work of the attributed author or publisher, and
ZFIN has permission only to display this image to its users.
Additional permissions should be obtained from the applicable author or publisher of the image.
Full text @ Stem Cell Reports