
Fig. 5
- ID
- ZDB-IMAGE-240912-56
- Genes
- Publication
- Huang et al., 2024 - mTORC1 mediates the expansion of hematopoietic stem and progenitor cells through ribosome biogenesis protein Urb2 in zebrafish
- All Figures
- Figures for Huang et al., 2024
|
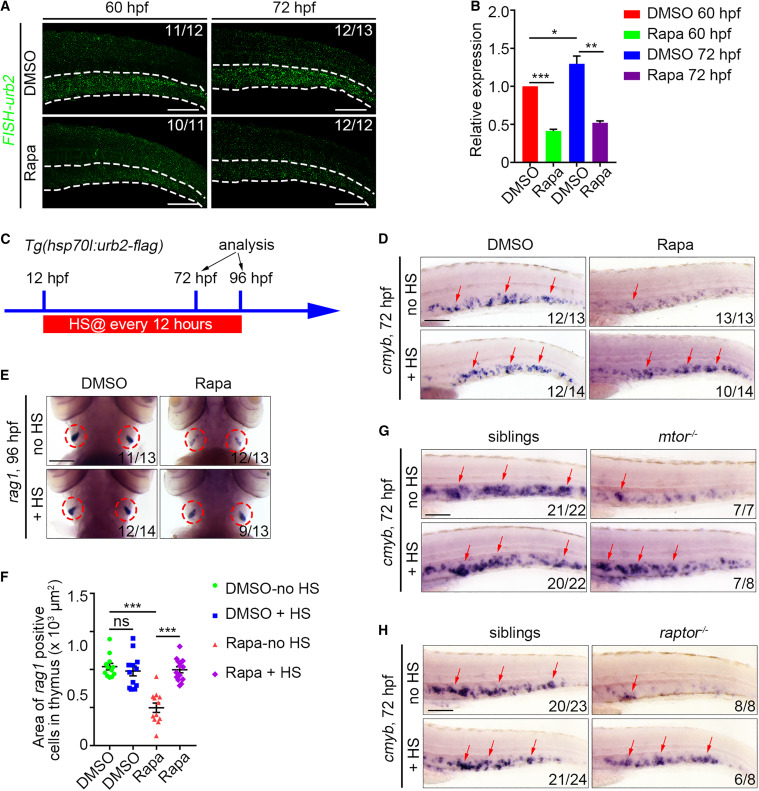
Fig. 5 Urb2 acts as a downstream effector of mTORC1 to regulate HSPC expansion (A) FISH images showing the urb2 expression in DMSO- or rapamycin-treated embryos at 60 and 72 hpf. White dashed lines mark the CHT region. (B) qPCR data showing the relative expression level of urb2 in the CHT at 60 and 72 hpf. ∗p < 0.05, ∗∗p < 0.01, ∗∗∗p < 0.001 on unpaired two-tailed t test (three independent experiments, with >20 embryos pooled per condition, per experiment). (C) Experimental scheme illustrating the heat-shocked condition. (D) WISH images showing the cmyb expression after urb2 overexpression in DMSO- and rapamycin-treated groups at 72 hpf. (E) WISH images showing the rag1 expression after urb2 overexpression in DMSO- and rapamycin-treated groups at 96 hpf. Circles indicate the thymus. (F) Quantification of the area of rag1+ cells in the thymus. ns, no significant difference. ∗∗∗p < 0.001 on unpaired two-tailed t test (n = number of total embryos from three independent experiments). (G and H) WISH images showing the cmyb expression after urb2 overexpression in the mtor mutant (G) and raptor mutant (H) at 72 hpf. Error bars represent SEM. Scale bars: 100 μm. Rapa, rapamycin; HS, heat shock.