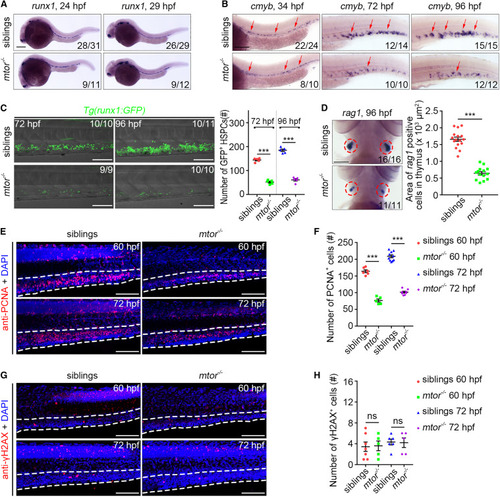
The mtor mutant exhibits defective HSPC expansion (A) WISH images showing the runx1 expression in siblings and mtor mutants at 24 and 29 hpf. (B) WISH images showing the cmyb expression in siblings and mtor mutants at 34, 72, and 96 hpf. Arrows indicate AGM at 34 hpf and CHT at 72 and 96 hpf. (C) Confocal projection images showing the runx1:GFP expression in CHT at 72 and 96 hpf. Quantification of the number of GFP+ HSPCs. ∗∗∗p < 0.001 on unpaired two-tailed t test (n = number of total embryos from three independent experiments). (D) WISH images showing the rag1 expression at 96 hpf. Circles indicate the thymus. Quantification of the area of rag1+ cells in the thymus. ∗∗∗p < 0.001 on unpaired two-tailed t test (n = number of total embryos from three independent experiments). (E) Confocal projection images showing PCNA antibody and DAPI stainings in siblings and mtor mutants at 60 and 72 hpf. (F) Quantification of the number of PCNA+ cells in the CHT. ∗∗∗p < 0.001 on unpaired two-tailed t test (n = 10 embryos from three independent experiments). (G) Confocal projection images showing γH2AX antibody and DAPI stainings at 60 and 72 hpf. (H) Quantification of the number of γH2AX+ cells in the CHT. ns, no significant difference (n = 7 embryos from three independent experiments). Error bars represent SEM. White dashed lines mark the CHT region. Scale bars: 100 μm.
|
