FIGURE SUMMARY
Title

CM082 suppresses hypoxia-induced retinal neovascularization in larval zebrafish

Authors
Zhang, J.L., Fan, D.G., Yin, W., Hu, B.
Source
Full text @ Front Pharmacol

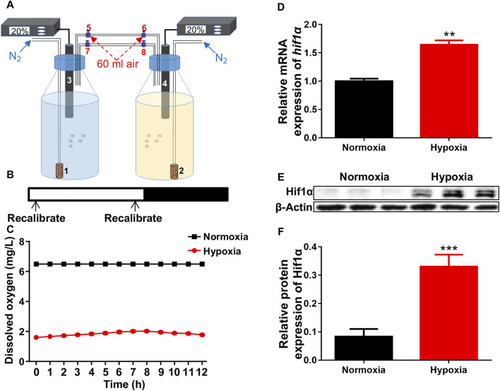
Hypoxic setup for larval zebrafish. (A) Pattern of hypoxic devices. 1 and 2, air diffuser; 3 and 4, oxygen electrode; 5–8, conduit connector. (B, C) The oxygen concentration inside the bottles were recalibrated to 20% air saturation (1.56 ppm, 1.6 mg/L) at each 12-h intervals (shown in B is not 12 h interval) from 1 to 5 dpf. (D) qRT-PCR analysis showed that the expression of hif1α was significantly increased after exposed to hypoxia. (E, F) Western blots showed that Hif1α protein expression was significantly increased under hypoxia. Hif1α, 110 kD; β-actin, 42 kD. *p < 0.05; **p < 0.01; ***p < 0.001.

CM082 suppressed retinal neovascularization induced by hypoxia. (A) Survival rate of zebrafish embryos exposed to CM082 from 0 to 200 μM under normoxia (n = 100 in each group). (B) Survival rate of zebrafish embryos in various media under normoxia or hypoxia (n = 100 in each group). (C–J) The retinal vessels in various media under normoxia and hypoxia conditions were imaged (n = 6 in each group). (K, N) The pattern shows the method for measuring and counting vessel diameters (red line), ratio of the area of IV relative to IRV (IV, white line; IRV, blue line) and branch points (yellow asterisks). The vessel diameter and the IV/IRV ratio were measured using Image J. (L) There was no significant difference on the vessel diameter among all the 8 groups. (M, O) Under normoxia, the number of branch points and the IV/IRV ratio were not significantly different among the 4 groups with various media. However, these two values were significantly higher in the hypoxia groups with EM or DMSO compared to the normoxia groups. Under hypoxia, this discrepancy was mitigated by 0.5 and 1 μM CM082. NRV, nasal radial vessel; DRV, dorsal radial vessel; VRV, ventral radial vessel; IV, intraocular vessel; IRV, intraocular ring vessel. Scale bar = 100 μm *p < 0.05; **p < 0.01; ***p < 0.001. Data represent the mean ± SEM.

CM082 rescued cell loss in the area of GCL induced by hypoxia. (A–H) The eyes’ HE-staining of larval zebrafish exposed to various media in both normoxia and hypoxia conditions. There were nearly no retinal lesions under normoxia (A–D). However, multiple retinal lesions appeared in the INL and GCL in hypoxia groups with EM (E) and DMSO (F) and reduced by 0.5 and 1 μM CM082 (G, H) (red arrowheads). (I, J) Quantification of cell numbers in the GCL area (yellow area) in eight groups (n = 4 in each group). Under normoxia, the cell numbers in GCL were not significantly different among the 4 groups with various media. However, there were significantly fewer GCL cells in the hypoxia groups with EM or DMSO compared to the normoxia groups, indicating hypoxia reduced the number of cells in GCL. The cell loss was partially abrogated by 0.5 and 1 μM CM082 under hypoxia. PRE, retinal pigmented epithelium; PCL, photoreceptor layer; OPL, outer plexiform layer; GCL, ganglion cell layer; IPL, inner plexiform layer; INL, inner nuclear layer. Scale bar = 50 μm *p < 0.05; **p < 0.01; ***p < 0.001. Data represent the mean ± SEM.

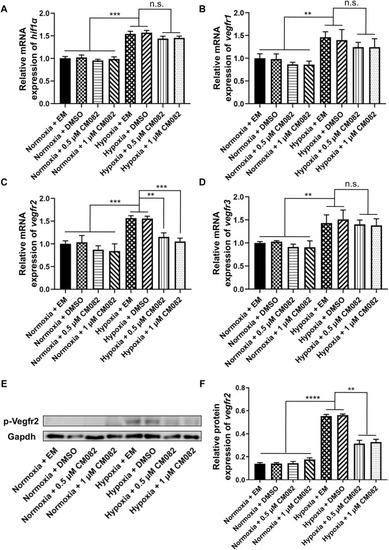
CM082 inhibited the expression of vegfr2 in the eyes of zebrafish larvae under hypoxia. (A–D) qRT-PCR analysis of hif1α, vegfr1, vegfr2 and vegfr3 in eight groups. (A, B, D) The results showed higher hif1α, vegfr1 and vegfr3 mRNA levels in hypoxia than normoxia. CM082 did not further altered the mRNA level. (C) The expression of vegfr2 was significantly upregulated under hypoxia, and downregulated by CM082. (E) Western blots of p-Vegfr2 and Gapdh. p-Vegfr2, 220 kD; Gapdh, 36 kD. (F) The expression of p-Vegfr2 was significantly upregulated under hypoxia, then downregulated by CM082. *p < 0.05; **p < 0.01; ***p < 0.001. Data represent the mean ± SEM.

CM082 rescued optokinetic response deficiency induced by hypoxia. (A) Scheme of OKR. Parameters of the grating patterns, including contrast, rotating direction and velocity were controlled by the computer. The eyes of the fish larva will follow the motion of the grating patters. Movement of the eyes were recorded by the camera and analyzed by the computer. (B, C) OKRs of larval zebrafish which were exposed to EM, DMSO, 0.5 or 1 μM CM082 in both normoxia and hypoxia conditions (Contrast = 0.6 and = 0.9; n = 6 in each group). The gains were lower in hypoxia than normoxia both in Contrast = 0.6 and in Contrast = 0.9. CM082 treatment partially rescued the gain in hypoxic larvae. *p < 0.05; **p < 0.01; ***p < 0.001. Data represent the mean ± SEM.

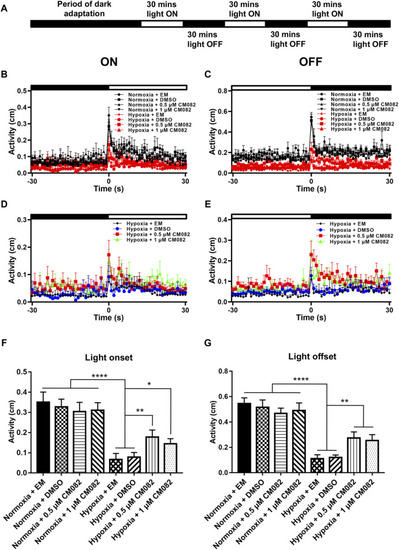
CM082 partially rescued visual motor response (VMR) deficiency induced by hypoxia. (A) Time frame of VMR. (B, C) Motor activity in response to light-on and light-off in larval zebrafish which were exposed to EM, DMSO, 0.5 or 1 μM CM082 in both normoxia and hypoxia conditions. The activities of normoxia groups are higher than hypoxia groups. (D, E) Motor activity in response to light-on and light-off in larval zebrafish which were exposed to EM, DMSO, 0.5 or 1 μM CM082 under hypoxia. (F, G) The activity of light onset and light offset in eight groups. There was no significant difference among the normoxic groups. However, the activity in hypoxia was significantly reduced and it was partially rescued by CM082. n = 12 in each group. *p < 0.05; **p < 0.01; ***p < 0.001. Data represent the mean ± SEM.

Acknowledgments
This image is the copyrighted work of the attributed author or publisher, and ZFIN has permission only to display this image to its users. Additional permissions should be obtained from the applicable author or publisher of the image. Full text @ Front Pharmacol