IMAGE

FIGURE 3

ID
ZDB-IMAGE-240813-8
Source
Figures for Zhang et al., 2024
Image
Figure Caption

FIGURE 3

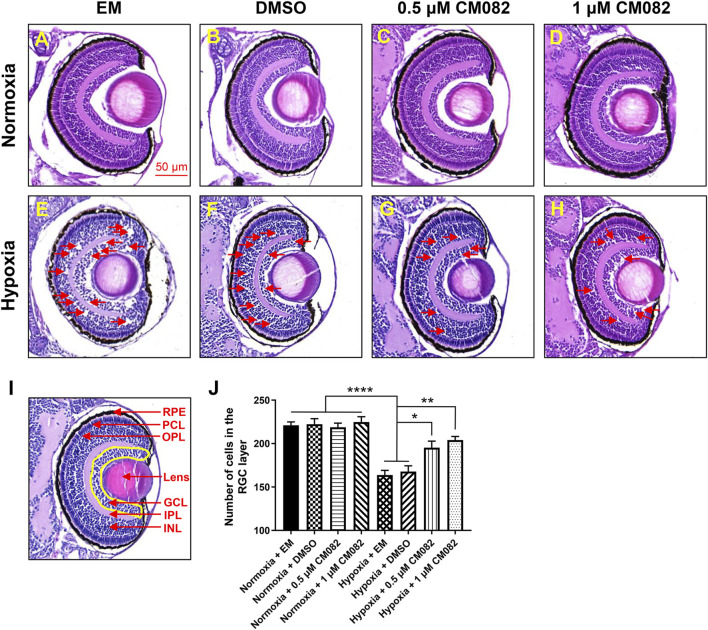
CM082 rescued cell loss in the area of GCL induced by hypoxia. (A–H) The eyes’ HE-staining of larval zebrafish exposed to various media in both normoxia and hypoxia conditions. There were nearly no retinal lesions under normoxia (A–D). However, multiple retinal lesions appeared in the INL and GCL in hypoxia groups with EM (E) and DMSO (F) and reduced by 0.5 and 1 μM CM082 (G, H) (red arrowheads). (I, J) Quantification of cell numbers in the GCL area (yellow area) in eight groups (n = 4 in each group). Under normoxia, the cell numbers in GCL were not significantly different among the 4 groups with various media. However, there were significantly fewer GCL cells in the hypoxia groups with EM or DMSO compared to the normoxia groups, indicating hypoxia reduced the number of cells in GCL. The cell loss was partially abrogated by 0.5 and 1 μM CM082 under hypoxia. PRE, retinal pigmented epithelium; PCL, photoreceptor layer; OPL, outer plexiform layer; GCL, ganglion cell layer; IPL, inner plexiform layer; INL, inner nuclear layer. Scale bar = 50 μm *p < 0.05; **p < 0.01; ***p < 0.001. Data represent the mean ± SEM.

Acknowledgments
This image is the copyrighted work of the attributed author or publisher, and ZFIN has permission only to display this image to its users. Additional permissions should be obtained from the applicable author or publisher of the image. Full text @ Front Pharmacol