
- Title
-
A zebrafish embryo screen utilizing gastrulation identifies the HTR2C inhibitor pizotifen as a suppressor of EMT-mediated metastasis
- Authors
- Nakayama, J., Tan, L., Li, Y., Cher Goh, B., Wang, S., Makinoshima, H., and Gong, Z.
- Source
- Full text @ Elife

A chemical screen for identification of epiboly-interrupting drugs. (A) Cumulative results of the chemical screen in which each drug was used at either 10 µM (left) or 50 µM (right) concentrations. 1280 FDA, EMA, or other agencies-approved drugs were subjected to this screening. Positive ‘hit’ drugs were those that interrupted epiboly progression. (B) Representative samples of the embryos that were treated with indicated drugs. |
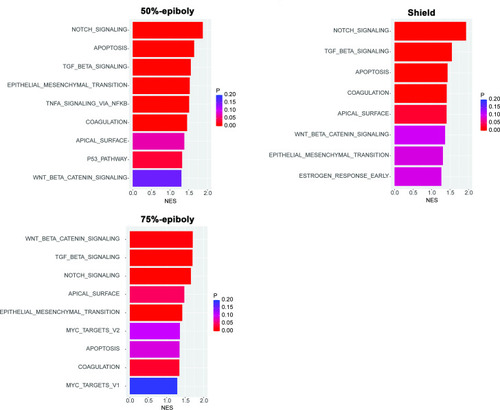
Gene expression profiles obtained from zebrafish embryos at either 50%-epiboly (top left), shield (top right), or 75%-epiboly stage (bottom left) were analyzed based on the hallmark gene sets derived from the Molecular Signatures Database (MSigDB) (Liberzon et al., 2015). The zebrafish transcriptomic data was sourced from White et al., 2017 eLife (Subramanian et al., 2005). Gene sets that were significantly enriched (FDR < 0.25) were presented with the normalized enrichment score (NES) and nominal p value. Source data files for analysis of either gene expression and enriched pathways are uploaded as gene set enrichment analysis (GSEA) Source data 1 and 2, respectively. |
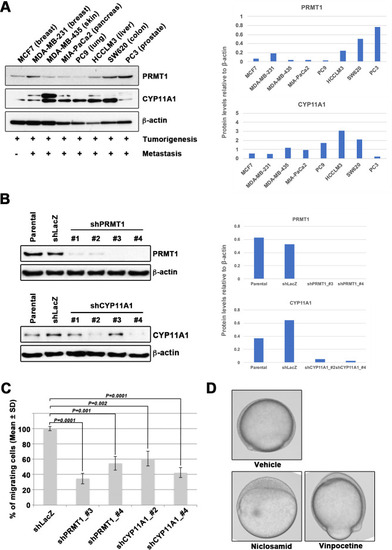
Epiboly could serve as a marker for this screening. (A) Western blot analysis of protein arginine methyltransferase 1 (PRMT1) (upper left) and cytochrome P450 family 11 (CYP11A1) (middle left) protein levels in non-metastatic human cancer cell line (MCF7) and highly metastatic human cancer cell lines (MDA-MB-231, MDA-MB-435, MIA-PaCa2, PC9, HCCLM3, PC3, and SW620); β-actin loading control is shown (bottom left). Preliminary experiments confirmed that epiboly could serve as a marker for this screening assay. Quantification analyses of western blotting bands. The analyses were performed by ImageJ. Signal strength of bands of PRMT1 (Top right) and CYP11A1 (bottom right) was normalized by that of β-actin. (B) Knockdown of PRMT1 or CYP11A1 in MDA-MB-231 cells. MBA-MB-231 cells were transfected with a control short hairpin RNA (shRNA) targeting LacZ, and one of four independent shRNAs targeting PRMT1 (clones #1 to #4), or one of two independent shRNAs targeting CYP11A1 (clones #1 to #4). Reduced PRMT1 and CYP11A1 expression, determined by western blot, in sub-cell lines of MDA-MB-231 cells expressing PRMT1 shRNA (clones #3 and #4) or CYP11A1 (clones #2 and #4), compared with controls (parental cell line MDA-MB-231 and control shRNA cells); β-actin levels shown as a loading control. Quantification analyses of western blotting bands. The analyses were performed by ImageJ. Signal strength of bands of PRMT1 (top right) and CYP11A1 (bottom right) was normalized by that of β-actin. (C) Effect of shRNAs targeting either PRMT1 or CYP11A1 on cell motility and invasion of MBA-MB-231 cells. Parental MDA-MB-231 cells and four sub-cell lines of MDA-MB-231 cells that were transfected with either shRNA targeting either LacZ, two independent shRNAs targeting PRMT1 (clones #3 and #4) or two independent shRNAs targeting CYP11A1 (clones #2 and #4) were subjected to Boyden chamber assays. (D) Zebrafish embryos treated with either vehicle (DMSO), 10 μM niclosamide, or 50 µM vinpocetine. Approximately 20 embryos were treated with either DMSO as a vehicle control, niclosamide, or vinpocetine. The treatment was started at 4 hours post fertilization (hpf) when all of embryos reached sphere stage and ended at 9 hpf when control embryos reached 80–90% epiboly stage. Each experiment was performed at least twice. Statistical analysis was determined by Student’s t test. |

Pizotifen, one of epiboly-interrupting drugs, suppressed metastatic dissemination of human cancer cells lines in vivo and vitro. (A) Effect of the epiboly-interrupting drugs on cell motility and invasion of MBA-MB-231 cells. MBA-MB-231 cells were treated with vehicle or each of the epiboly-interrupting drugs and then subjected to Boyden chamber assays. Fetal bovine serum (1% v/v) was used as the chemoattractant in both assays. Each experiment was performed at least twice. (B) Western blot analysis of HTR2C levels (top) in a non-metastatic human cancer cell line, MCF7 (breast) and highly metastatic human cancer cell lines, MDA-MB-231 (breast), MDA-MB-435 (melanoma), PC9 (lung), MIA-PaCa2 (pancreas), PC3 (prostate), and SW620 (colon); GAPDH loading control is shown (bottom). (C) Effect of pizotifen on cell motility and invasion of MBA-MB-231, MDA-MB-435, and PC9 cells. Either vehicle or pizotifen treated the cells were subjected to Boyden chamber assays. Fetal bovine serum (1% v/v) was used as the chemoattractant in both assays. Each experiment was performed at least twice. (D) and (E) Representative images of dissemination of 231R, shLacZ 231R or shHTR2C 231R cells in zebrafish xenotransplantation model. The fish larvae that were inoculated with 231R cells were treated with either vehicle (top left) or the drug (lower left) (D). The fish larvae that were inoculated with either shLacZ 231R or shHTR2C 231R cells (lower left) (E). White arrows head indicate disseminated 231R cells. The images were shown in 4× magnification. Scale bar, 100 µm. The mean frequencies of the fish showing head, trunk, or end-tail dissemination were counted (graph on right). Each value is indicated as the mean ± SEM of two independent experiments. Statistical analysis was determined by Student’s t test. |
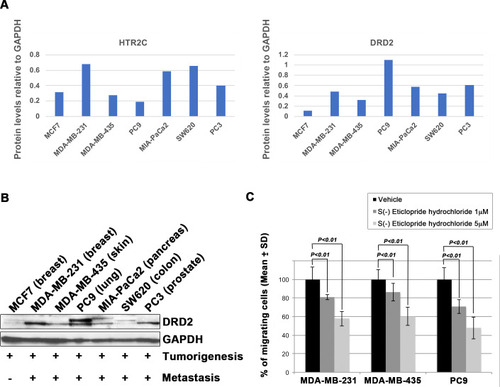
Blocking Dopamine receptor D2 with S(-) Eticlopride hydrochloride suppressed cell motility and invasion of highly metastatic human cancer cells in a dose-dependent manner. (A) Quantification analyses of western blotting bands in Figure 2B. The analyses were performed by ImageJ. Signal strength of bands of HTR2C (left) and DRD2 (right) was normalized by that of GAPDH. (B) Western blot analysis of DRD2 levels in non-metastatic human cancer cell line, MCF7 (breast) and highly metastatic human cancer cell lines, MDA-MB-231 (breast), MDA-MB-435 (melanoma), MIA-PaCa2 (pancreas), PC3 (prostate), and SW620 (colon); GAPDH loading control is shown (bottom). GAPDH control was obtained in the same experiment from Figure 2B. (C) Effect of S(-)eticlopride hydrochloride on cell motility and invasion of MBA-MB-231, MDA-MB-435, and PC9 cells. Either vehicle- or pizotifen-treated cells were subjected to Boyden chamber assays. Fetal bovine serum (1% v/v) was used as the chemoattractant in both assays. Each experiment was performed at least twice. Statistical analysis was determined by Student’s t test. |
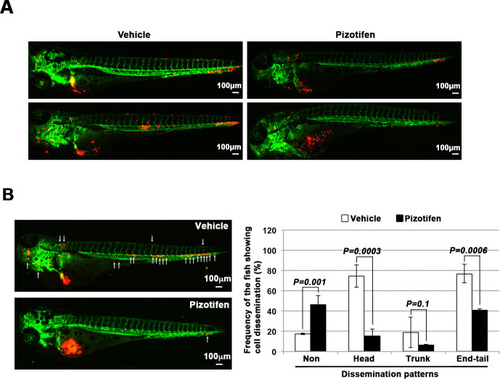
Pizotifen suppressed metastatic dissemination of MDA-MB-231 and MIA-PaCa2 cells in a zebrafish xenotransplantation model. (A) Representative images of dissemination of 231R cells in zebrafish xenotransplantation model. The fish larvae that were inoculated with 231R cells were treated with either vehicle (top left, bottom left) or pizotifen (top right, bottom right). (B) Representative images of dissemination of MIA-PaCa2 cells in zebrafish xenotransplantation model. The fish were inoculated with MIA-PaCa2 cells, and treated with either vehicle (top left) or drug (lower left). White arrow heads indicate disseminated MIA-PaCa2 cells. The images were shown in 4× magnification. Scale bar, 100 μm. The mean frequencies of the fish showing head, trunk, or end-tail dissemination were tabulated (right). Each value is indicated as the mean ± SEM of two independent experiments. Statistical analysis was determined by Student’s t test. |

Pizotifen suppressed metastatic progression in a mouse model of metastasis. (A) Mean volumes (n = 10 per group) of 4T1 primary tumors formed in the mammary fat pad of either vehicle- or pizotifen-treated mice at day 10 post injection. (B) Ki67 expression level in 4T1 primary tumors formed in the mammary fat pad of either vehicle- or pizotifen-treated mice at day 10 post injection. The mean expression levels of Ki67 (n = 10 mice per group) were determined and were calculated as the mean ration of Ki67-positive cells to 4’,6-diamidino-2-phenylindole (DAPI) area. (C) Representative images of primary tumors on day 10 post injection (top panels) and metastatic burden on day 70 post injection (bottom panels) taken using an IVIS Imaging System. (D) Representative images of the lungs from either vehicle- (top) or pizotifen-treated mice (bottom) at 70 days post tumor inoculation. Number of metastatic nodules in the lung of either vehicle- or pizotifen-treated mice (right). (E) Representative hematoxylin and eosin (H&E) staining of the lung (top) and liver (bottom) from either vehicle- or pizotifen-treated mice. Black arrow heads indicate metastatic 4T1 cells. (F) The mean number of metastatic lesions in step sections of the lungs from the mice that were inoculated with 4T1-12B cells expressing short hairpin RNA (shRNA) targeting for either LacZ or HTR2C. (G) Representative H&E staining of the lung and liver from the mice that were inoculated with 4T1-12B cells expressing shRNA targeting for either LacZ or HTR2C. Black arrow heads indicate metastatic 4T1 cells. Each value is indicated as the mean ± SEM. Statistical analysis was determined by Student’s t test. |
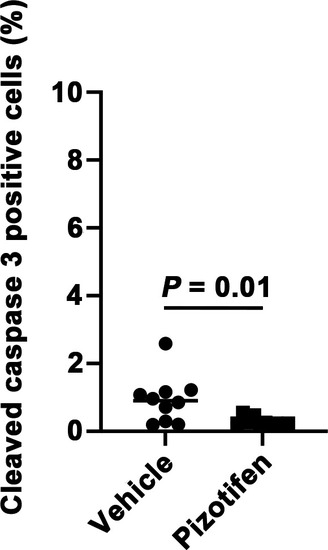
Cleaved caspase 3 expression level in 4T1 primary tumors formed in the mammary fat pad of either vehicle- or pizotifen-treated mice at day 10 post injection. |
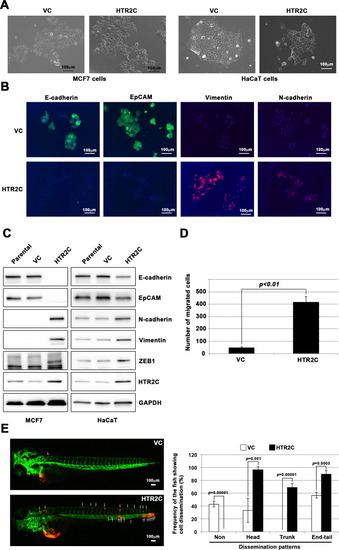
HTR2C induced epithelial-to-mesenchymal transition (EMT)-mediated metastatic dissemination of human cancer cells. (A) The morphologies of the MCF7 and HaCaT cells expressing either the control vector or HTR2C were revealed by phase contrast microscopy. (B) Immunofluorescence staining of E-cadherin, EpCAM, vimentin, and N-cadherin expressions in the MCF7 cells from A. (C) Expression of E-cadherin, EpCAM, vimentin, N-cadherin, and HTR2C was examined by western blotting in the MCF7 and HaCaT cells; GAPDH loading control is shown (bottom). (D) Effect of HTR2C on cell motility and invasion of MCF7 cells. MCF7 cells were subjected to Boyden chamber assays. Fetal bovine serum (1% v/v) was used as the chemoattractant in both assays. Each experiment was performed at least twice. (E) Representative images of dissemination patterns of MCF7 cells expressing either the control vector (top left) or HTR2C (lower left) in a zebrafish xenotransplantation model. White arrow heads indicate disseminated MCF7 cells. The mean frequencies of the fish showing head, trunk, or end-tail dissemination tabulated (right). Each value is indicated as the mean ± SEM of two independent experiments. Statistical analysis was determined by Student’s t test. |

HTR2C promoted EMT-mediated metastatic dissemination of poorly metastatic human cancer cells in a zebrafish xenotransplantation model. (A) Quantification analyses of western blotting bands in Figure 4C. The analyses were performed by ImageJ. Signal strength of bands of E-cadherin, EpCAM, N-cadherin, vimentin, ZEB1, and HTR2C was normalized by that of GAPDH. (B) Representative images of dissemination patterns of MCF7 cells expressing either the control vector (top left, middle left, bottom left) or HTR2C (top right, middle right, bottom right) in a zebrafish xenotransplantation model. |
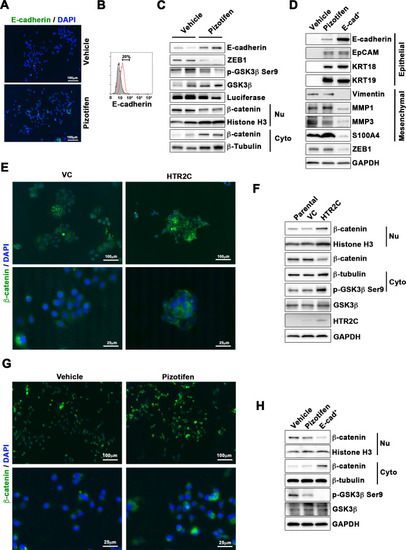
Pizotifen restored mesenchymal-like traits of MDA-MB-231 cells into epithelial traits through blocking nuclear accumulation of β-catenin. (A) Immunofluorescence (IF) staining of E-cadherin in either vehicle- or pizotifen-treated MDA-MB-231 cells. (B) Surface expression of E-cadherin in either vehicle (black)- or pizotifen (red)-treated MDA-MB-231 cells by FACS analysis. Non-stained controls are shown in gray. (C) Protein expressions levels of E-cadherin, ZEB1, and β-catenin in the cytoplasm and nucleus of 4T1 primary tumors from either vehicle- or pizotifen-treated mice are shown; Luciferase, histone H3, and β-tubulin are used as loading control for whole cell, nuclear, or cytoplasmic lysate, respectively. (D) Protein expression levels of epithelial and mesenchymal markers and ZEB1 in either vehicle- or pizotifen-treated MDA-MB-231 cells or E-cadherin-positive (E-cad+) cells in pizotifen-treated MDA-MB-231 cells are shown. (E) IF staining of β-catenin in the MCF7 cells expressing either vector control (top left, bottom left) or HTR2C (top right, bottom right). (F) Expressions of β-catenin in the cytoplasm and nucleus of MCF7 cells. (G) IF staining of β-catenin in either vehicle (top left, bottom left) or pizotifen-treated MDA-MB-231 cells (top right, bottom right). (H) Expressions of β-catenin in the cytoplasm and nucleus of MDA-MB-231 cells and the E-cad+ cells. |
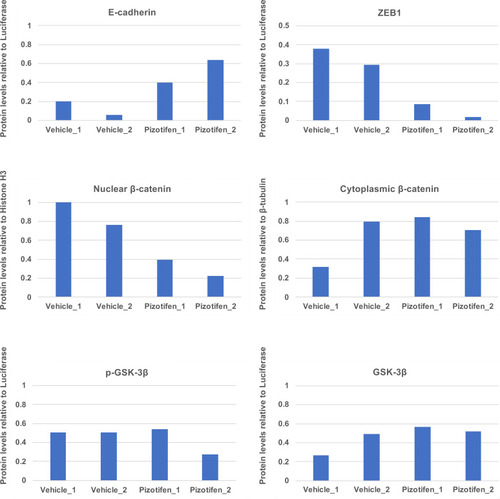
Quantification analyses of western blotting bands in Figure 5C. The analyses were performed by ImageJ. Signal strength of bands of E-cadherin, EpCAM, p-GSK-3β, GSK-3β were normalized by that of luciferase. Signal strength of bands of nuclear and cytoplasmic β-catenin was normalized by that of histone H3 and β-tubulin, respectively. |
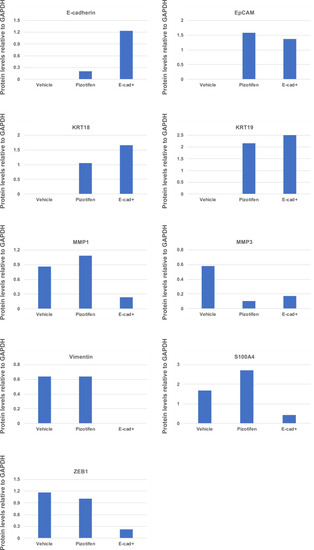
Quantification analyses of western blotting bands in Figure 5D. The analyses were performed by ImageJ. Signal strength of bands of E-cadherin, EpCAM, KRT18, KRT19, MMP1, MMP3, vimentin, and S100A4 was normalized by that of GAPDH. |
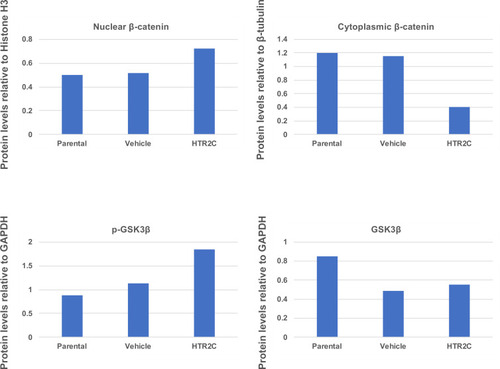
Quantification analyses of western blotting bands in Figure 5F. The analyses were performed by ImageJ. Signal strength of bands of nuclear and cytoplasmic β-catenin was normalized by that of histone H3 and β-tubulin, respectively. Signal strength of bands of p-GSK-3β and GSK-3β was normalized by that of GAPDH. |

Expression of Snail and Twist1 was examined by western blotting in the MCF7 cells (left); GAPDH loading control is shown (bottom). GAPDH band is the same as one from Figure 4C since GAPDH bands in Figure 4C (bottom left) and Figure 5—figure supplement 4 (bottom left) were obtained in the same experiment. Protein expression levels of Twist1 in either vehicle- or pizotifen-treated MDA-MB-231 cells are shown (middle): GAPDH loading control is shown (bottom). Protein expression levels of Snail and Twist1 of 4T1 primary tumors from either vehicle- or pizotifen-treated mice are shown (right); luciferase is used as loading control for whole cell. Luciferase control was obtained in the same experiment from Figure 5C. |
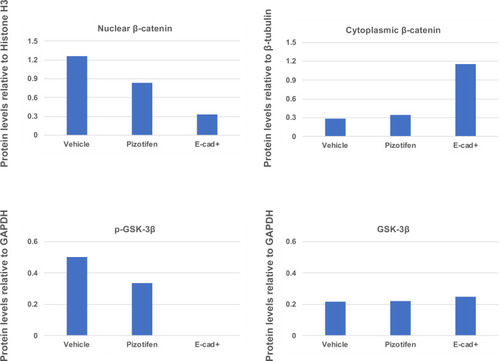
Quantification analyses of western blotting bands in Figure 5H. The analyses were performed by ImageJ. Signal strength of bands of nuclear and cytoplasmic β-catenin was normalized by that of histone H3 and β-tubulin, respectively. Signal strength of bands of p-GSK-3β and GSK-3β was normalized by that of GAPDH. |