
Fig. 1 Supplemental 1
- ID
- ZDB-FIG-240801-10
- Publication
- Nakayama et al., 2021 - A zebrafish embryo screen utilizing gastrulation identifies the HTR2C inhibitor pizotifen as a suppressor of EMT-mediated metastasis
- Other Figures
- All Figure Page
- Back to All Figure Page
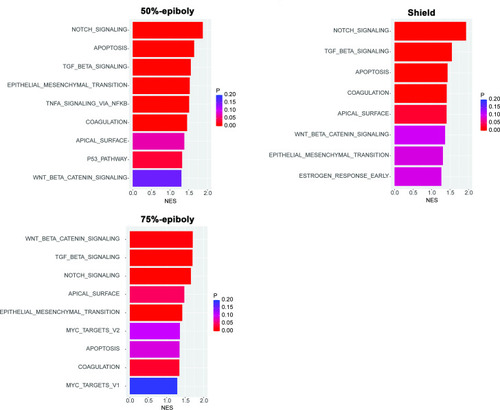
Gene expression profiles obtained from zebrafish embryos at either 50%-epiboly (top left), shield (top right), or 75%-epiboly stage (bottom left) were analyzed based on the hallmark gene sets derived from the Molecular Signatures Database (MSigDB) (Liberzon et al., 2015). The zebrafish transcriptomic data was sourced from White et al., 2017 eLife (Subramanian et al., 2005). Gene sets that were significantly enriched (FDR < 0.25) were presented with the normalized enrichment score (NES) and nominal p value. Source data files for analysis of either gene expression and enriched pathways are uploaded as gene set enrichment analysis (GSEA) Source data 1 and 2, respectively. |