
Image
|
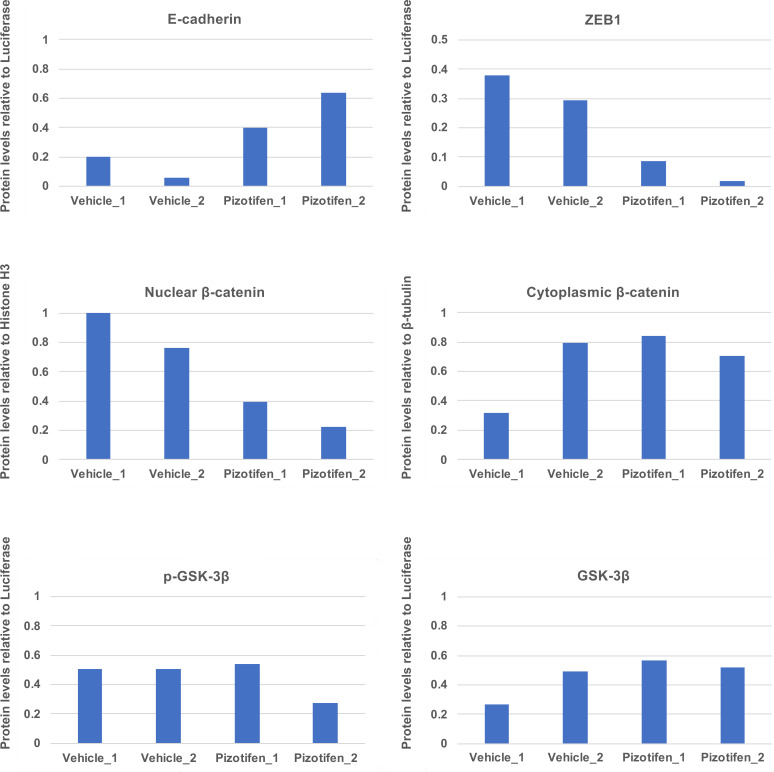
Figure Caption
Fig. 5 Supplemental 1 Quantification analyses of western blotting bands in Figure 5C. The analyses were performed by ImageJ. Signal strength of bands of E-cadherin, EpCAM, p-GSK-3β, GSK-3β were normalized by that of luciferase. Signal strength of bands of nuclear and cytoplasmic β-catenin was normalized by that of histone H3 and β-tubulin, respectively.
Acknowledgments
This image is the copyrighted work of the attributed author or publisher, and
ZFIN has permission only to display this image to its users.
Additional permissions should be obtained from the applicable author or publisher of the image.
Full text @ Elife