
- Title
-
A simple and scalable zebrafish model of Sonic hedgehog medulloblastoma
- Authors
- Casey, M.J., Chan, P.P., Li, Q., Zu, J.F., Jette, C.A., Kohler, M., Myers, B.R., Stewart, R.A.
- Source
- Full text @ Cell Rep.
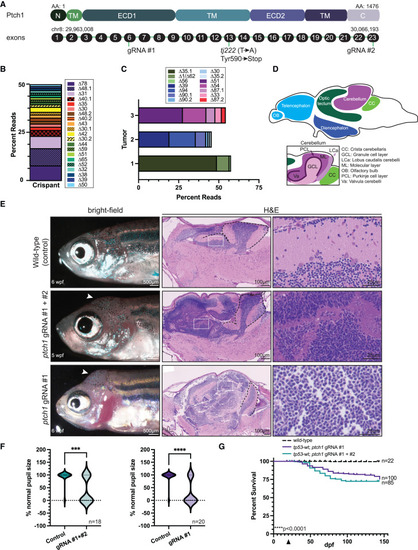
Transient ptch1 crispants develop brain tumors (A) Schematic of the zebrafish Ptch1 protein domains and corresponding exons. gRNA target sites and the germline premature stop mutation (tj222, relevant to Figure 3) are indicated. The chromosomal location is noted above the first and last exon, and the number of amino acids from N terminus to C terminus is indicated. N, N-terminal domain; TM, transmembrane domain; ECD1 and ECD2, extracellular domains 1 and 2; C, C-terminal domain. (B) Allele frequency of the mutations caused by the ptch1 gRNA #1 identified in a pooled batch of primary injected (crispant) 24-hpf genomic DNA. Embryos were pooled after verification of CRISPR cutting via high-resolution melting analysis. Mutations with the same deletion size (“Delta #”) but different genomic locations are denoted by “Delta#.1” or “Delta#.2” (e.g., “Δ48.1” and “Δ48.2” are both a deletion of 48 bp but in different genomic locations). (C) Allele frequency of the mutations caused by the ptch1 gRNA #1 identified from three individual ptch1-crispant whole brains as determined by CRISPR sequencing, with duplicates removed based upon unique molecular identifier (UMI) sequence information. Mutations with the same deletion size but different genomic location are denoted as in (B). (D) Schematic of the major regions of the zebrafish brain (top), with distinct subcompartments of the cerebellum highlighted (bottom). (E) (Left) Bright-field images of 5–6 wpf wild-type AB animals that were injected at the one-cell stage with the indicated ptch1 gRNAs. Uninjected wild-type fish served as a negative control for this experiment. (Middle and right) Sagittal sections of either control brain or ptch1-crispant brain tumors stained with H&E. White arrowheads indicate the location of the tumor in the left. White boxes in the middle are shown at higher magnification in the right. Black dashed lines indicate the cerebellum. (F) Animals from the experiment described in (E) were analyzed for the presence of smaller pupils. The percentage of animals from each experimental group with normal pupil size was quantified. Data are plotted as a violin plot, with the upper portion indicating the number of normal animals and the lower portion the number of animals with smaller pupils. The total number of animals per group is indicated in the lower right corner. Statistical significance was calculated using an unpaired two-tailed t test. ∗∗∗p = 0.0003, ∗∗∗∗p < 0.0001. (G) Wild-type zebrafish were either left uninjected or were injected at the one-cell stage with either ptch1 gRNAs #1 and #2 or ptch1 gRNA #1 alone, and analyzed for survival following injection. The arrowhead on the x axis indicates the beginning of survival analysis. The total number of animals per group is indicated on the right. Data are plotted from a single experiment, and experiments were repeated twice. Statistical significance was calculated using the Mantel-Cox test. ∗∗∗∗p < 0.0001. See also Figure S1 and Table S1. |
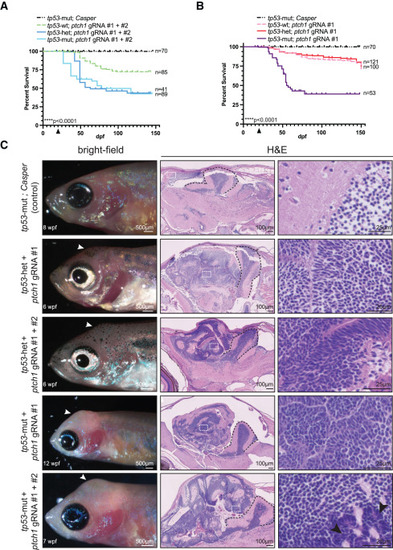
Mutation in tp53 promotes aggressiveness in ptch1-crispant brain tumors (A and B) Zebrafish from the indicated genetic backgrounds were injected at the one-cell stage with either ptch1 gRNAs #1 and #2 (A) or ptch1 gRNA #1 alone (B) and analyzed for survival following injection. The arrowhead on the x axis indicates the beginning of survival analysis. The total number of animals per group is indicated on the right. Data are plotted from a single experiment except for tp53-mut conditions, where data had to be pooled from multiple experiments to generate enough animals. Experiments were repeated at least twice. Statistical significance was calculated using the Mantel-Cox test. ∗∗∗∗p < 0.0001. (C) (Left) Bright-field images of 6–12 wpf animals with the indicated genetic backgrounds that were injected at the one-cell stage with either ptch1 gRNA #1 alone or ptch1 gRNAs #1 and #2. (Middle and right) Sagittal sections of control brain or ptch1-crispant brain tumors stained with H&E. White arrowheads indicate location of the tumor in the left. Black arrowheads in the lower right indicate larger neoplastic cells with more nuclear molding. White boxes in the middle are shown at higher magnification in the right. Black dashed lines in the middle indicate the cerebellum. See also Figure S1 and Table S1. Adult germline ptch1 mutants develop brain tumors To independently verify that loss of ptch1 causes brain tumors in zebrafish, we next tested whether germline loss of ptch1 also gives rise to brain tumors. Due to the short lifespan and compromised health of the transient ptch1-crispant adult animals (Figure 1), it was not possible to establish a stable line using our ptch1-crispant methodology. We therefore obtained and analyzed a previously established ptch1tj222 line that has a premature stop codon at position 590 (Figures 1A and 3) and has primarily been studied during embryonic development.38,39 As expected from previous reports, most of the ptch1tj222 homozygotes died at early developmental stages; however, we identified four homozygous mutant escapers out of 147 adults (∼37 homozygotes would be expected with normal Mendelian ratios) from an incross between ptch1tj222 heterozygotes. All four homozygous mutants developed brain tumors that resemble ptch1-crispant tumors at the morphological level, and the ability to form tumors was independent of tp53 status (Figure 3A). Analysis of the germline ptch1-null allele supports the conclusion that loss of ptch1 drives the development of brain tumors in zebrafish. |
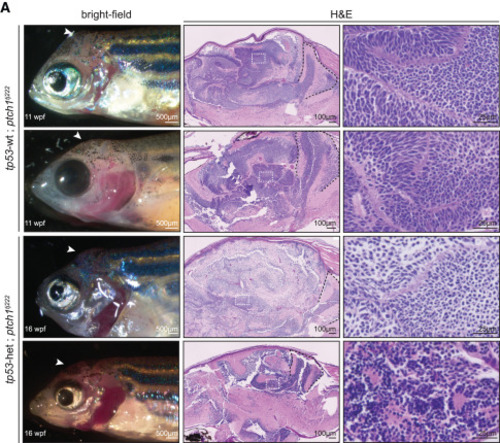
Zebrafish germline ptch1-mutant adults develop brain tumors (Left) Bright-field images of the germline ptch1tj222 homozygous mutant animals that survived to juvenile/adult stages. (Middle and right) Sagittal sections of ptch1tj222 brain tumors stained with H&E. White arrowheads indicate location of the tumor in the left. White boxes in the middle are shown at higher magnification in the right. Black dashed lines indicate the cerebellum in the middle. See also Figure S1. |
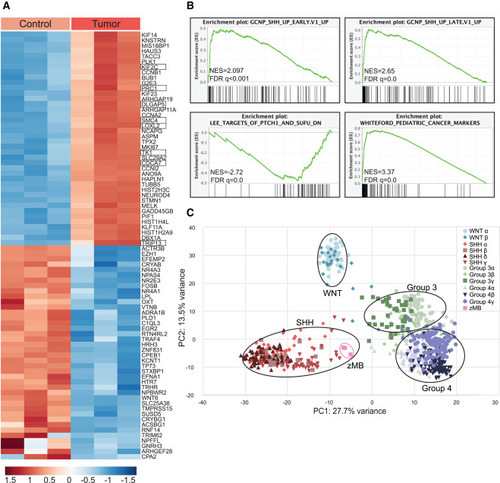
Zebrafish ptch1-crispant brain tumors resemble human SHH medulloblastoma (A) Heatmap of the top 40 differentially regulated genes in tp53M214K control brain tissue (Control) and tp53M214K; ptch1 gRNA #1 brain-tumor tissue (Tumor). Three biological replicates were analyzed per group. Control animals were 52 wpf, and tumor animals were 4–7 wpf. Genes were filtered for those that had clear human homologs. SHH-pathway response genes are boxed.40 (B) GSEA was performed to identify expression pathways enriched in tp53M214K; ptch1-crispant brain-tumor tissue compared to tp53M214K control brain. NES, normalized enrichment score; FDR, false discovery rate. (C) Principal-component analysis (PCA) comparing zebrafish tp53M214K; ptch1-crispant brain tumors with human MB samples that previously defined four major MB subgroups: SHH, WNT, group 3, and group 4. The zebrafish tumors (pink boxes) cluster with the human SHH subgroup, as indicated. See also Figures S2–S5 and Table S2. |
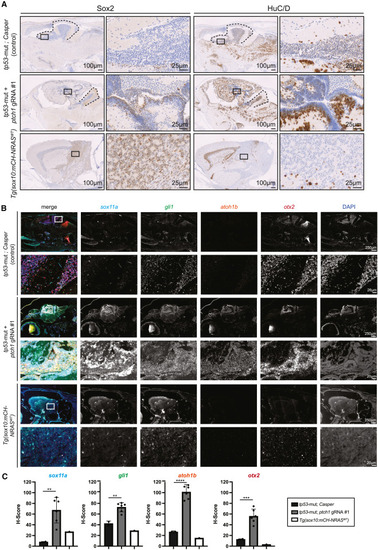
Zebrafish ptch1-crispant brain tumors are heterogeneous for neural stem cells and differentiated neurons with elevated SHH-pathway genes (A) Immunohistochemistry of Sox2 (left) and HuC/D (right) in the indicated genetic backgrounds. A higher magnification of the black-boxed area is shown in the adjacent panels to the right. Black dashed lines indicate the cerebellum. (B) Immunofluorescent RNAscope in the indicated genetic backgrounds with probes against sox11a, gli1, atoh1b, and otx2. Individual probes are shown in grayscale. White boxes in the upper left are shown at higher magnification below. DAPI was used as a nuclear marker. (C) The H score was independently calculated for each RNAscope probe and is plotted with the standard deviation. Each dot represents an individual section. Statistical significance was calculated using an unpaired two-tailed t test. ∗∗p < 0.006, ∗∗∗p = 0.0004, ∗∗∗∗p < 0.0001. See also Figures S1 and S2. |
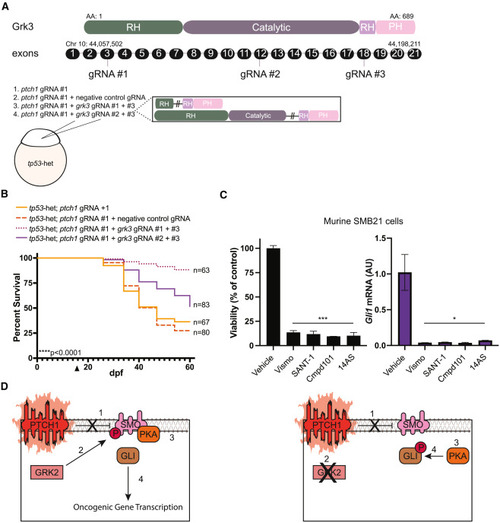
Loss of grk3 improves overall survival of ptch1 animals and decreases viability of SHH MB cells (A) (Top) Schematic of the zebrafish Grk3 protein domains and corresponding exons. gRNA target sites are indicated. The chromosomal location is noted above the first and last exon, and the number of amino acids from N terminus to C terminus is indicated. RH, RGS-homology domain; Catalytic, catalytic domain; PH, pleckstrin-homology domain. (Bottom) Schematic of injection strategy and predicted zebrafish Grk3 mutant protein. (B) Zebrafish from the indicated genetic backgrounds were injected at the one-cell stage with (1) ptch1 gRNA #1 alone, (2) ptch1 gRNA #1 + negative control gRNA, (3) ptch1 gRNA #1 + grk3 gRNA #1 and #3, or (4) ptch1 gRNA #1 + grk3 gRNA #2 and #3 and analyzed for survival following injection. The arrowhead on the x axis indicates the beginning of survival analysis. The total number of animals per group is indicated on the right. Data are plotted from a single experiment, and experiments were repeated twice. Statistical significance was calculated using the Mantel-Cox test. ∗∗∗∗p < 0.0001. (C) Cell viability and Gli1 mRNA levels in murine SMB21 cells treated with the indicated SMO inhibitors (vismodegib [Vismo] or SANT-1), GRK2/3 inhibitors (compound 101 [Cmpd101] or 14AS), or DMSO control (vehicle). The viability and RT-qPCR measurements were normalized against vehicle control to 100% (left y axis) or 1 (right y axis), respectively, and plotted with the standard deviation. Experiments were repeated twice with three technical replicates. Statistical signficance was calculated using an unpaired two-tailed t test. AU, arbitrary units. ∗p = 0.02, ∗∗∗p = 0.0003. (D) Model describing how loss of GRK2 disrupts SHH-induced tumorigenesis. (Left) In PTCH1-deficient MB tumors, SMO cannot be inhibited by mutant PTCH1 (step 1). Consequently, SMO is in an active, sterol-bound confirmation, leading to GRK2 phosphorylation (step 2), which enables SMO to bind and inhibit PKA (step 3). Since GLI transcription factors are no longer phosphorylated by PKA, they constitutively transactivate SHH target genes (step 4). (Right) In PTCH1-deficient MB tumors, SMO cannot be inhibited by mutant PTCH1 (step 1). Loss/inhibition of GRK2 prevents the phosphorylation of SMO (step 2), and as a result SMO is unable to bind and inhibit PKA (step 3). Free PKA phosphorylates GLI transcription factors and prevents their activation (step 4), and SHH target genes fail to be transactivated. Thus, inhibition of GRK2 represents a potentially useful treatment strategy for PTCH1-mutant MB tumors. |
|