
|
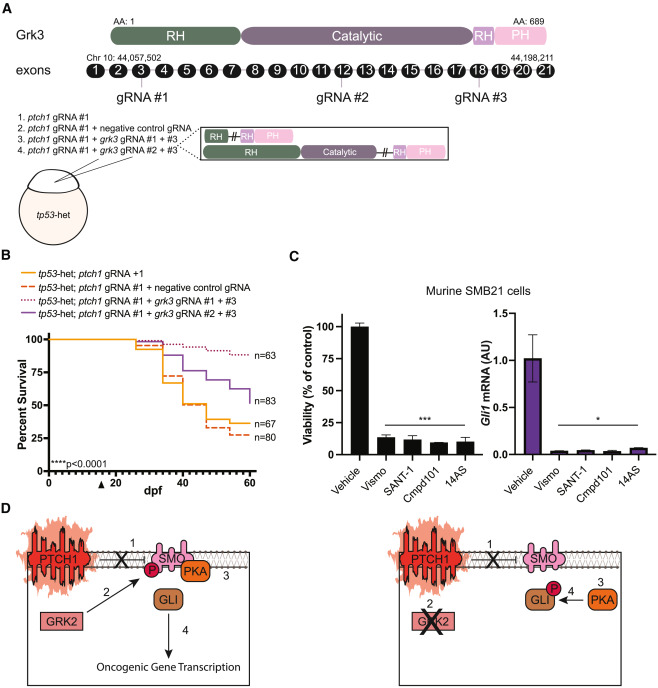
Fig. 6 Loss of grk3 improves overall survival of ptch1 animals and decreases viability of SHH MB cells (A) (Top) Schematic of the zebrafish Grk3 protein domains and corresponding exons. gRNA target sites are indicated. The chromosomal location is noted above the first and last exon, and the number of amino acids from N terminus to C terminus is indicated. RH, RGS-homology domain; Catalytic, catalytic domain; PH, pleckstrin-homology domain. (Bottom) Schematic of injection strategy and predicted zebrafish Grk3 mutant protein. (B) Zebrafish from the indicated genetic backgrounds were injected at the one-cell stage with (1) ptch1 gRNA #1 alone, (2) ptch1 gRNA #1 + negative control gRNA, (3) ptch1 gRNA #1 + grk3 gRNA #1 and #3, or (4) ptch1 gRNA #1 + grk3 gRNA #2 and #3 and analyzed for survival following injection. The arrowhead on the x axis indicates the beginning of survival analysis. The total number of animals per group is indicated on the right. Data are plotted from a single experiment, and experiments were repeated twice. Statistical significance was calculated using the Mantel-Cox test. ∗∗∗∗p < 0.0001. (C) Cell viability and Gli1 mRNA levels in murine SMB21 cells treated with the indicated SMO inhibitors (vismodegib [Vismo] or SANT-1), GRK2/3 inhibitors (compound 101 [Cmpd101] or 14AS), or DMSO control (vehicle). The viability and RT-qPCR measurements were normalized against vehicle control to 100% (left y axis) or 1 (right y axis), respectively, and plotted with the standard deviation. Experiments were repeated twice with three technical replicates. Statistical signficance was calculated using an unpaired two-tailed t test. AU, arbitrary units. ∗p = 0.02, ∗∗∗p = 0.0003. (D) Model describing how loss of GRK2 disrupts SHH-induced tumorigenesis. (Left) In PTCH1-deficient MB tumors, SMO cannot be inhibited by mutant PTCH1 (step 1). Consequently, SMO is in an active, sterol-bound confirmation, leading to GRK2 phosphorylation (step 2), which enables SMO to bind and inhibit PKA (step 3). Since GLI transcription factors are no longer phosphorylated by PKA, they constitutively transactivate SHH target genes (step 4). (Right) In PTCH1-deficient MB tumors, SMO cannot be inhibited by mutant PTCH1 (step 1). Loss/inhibition of GRK2 prevents the phosphorylation of SMO (step 2), and as a result SMO is unable to bind and inhibit PKA (step 3). Free PKA phosphorylates GLI transcription factors and prevents their activation (step 4), and SHH target genes fail to be transactivated. Thus, inhibition of GRK2 represents a potentially useful treatment strategy for PTCH1-mutant MB tumors.