
Fig. 1
- ID
- ZDB-FIG-240903-171
- Publication
- Casey et al., 2024 - A simple and scalable zebrafish model of Sonic hedgehog medulloblastoma
- Other Figures
- All Figure Page
- Back to All Figure Page
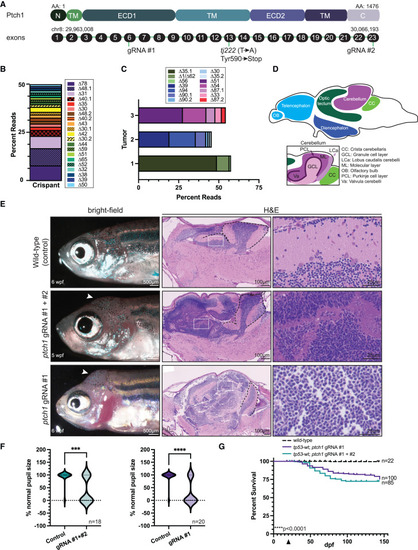
Transient ptch1 crispants develop brain tumors (A) Schematic of the zebrafish Ptch1 protein domains and corresponding exons. gRNA target sites and the germline premature stop mutation (tj222, relevant to Figure 3) are indicated. The chromosomal location is noted above the first and last exon, and the number of amino acids from N terminus to C terminus is indicated. N, N-terminal domain; TM, transmembrane domain; ECD1 and ECD2, extracellular domains 1 and 2; C, C-terminal domain. (B) Allele frequency of the mutations caused by the ptch1 gRNA #1 identified in a pooled batch of primary injected (crispant) 24-hpf genomic DNA. Embryos were pooled after verification of CRISPR cutting via high-resolution melting analysis. Mutations with the same deletion size (“Delta #”) but different genomic locations are denoted by “Delta#.1” or “Delta#.2” (e.g., “Δ48.1” and “Δ48.2” are both a deletion of 48 bp but in different genomic locations). (C) Allele frequency of the mutations caused by the ptch1 gRNA #1 identified from three individual ptch1-crispant whole brains as determined by CRISPR sequencing, with duplicates removed based upon unique molecular identifier (UMI) sequence information. Mutations with the same deletion size but different genomic location are denoted as in (B). (D) Schematic of the major regions of the zebrafish brain (top), with distinct subcompartments of the cerebellum highlighted (bottom). (E) (Left) Bright-field images of 5–6 wpf wild-type AB animals that were injected at the one-cell stage with the indicated ptch1 gRNAs. Uninjected wild-type fish served as a negative control for this experiment. (Middle and right) Sagittal sections of either control brain or ptch1-crispant brain tumors stained with H&E. White arrowheads indicate the location of the tumor in the left. White boxes in the middle are shown at higher magnification in the right. Black dashed lines indicate the cerebellum. (F) Animals from the experiment described in (E) were analyzed for the presence of smaller pupils. The percentage of animals from each experimental group with normal pupil size was quantified. Data are plotted as a violin plot, with the upper portion indicating the number of normal animals and the lower portion the number of animals with smaller pupils. The total number of animals per group is indicated in the lower right corner. Statistical significance was calculated using an unpaired two-tailed t test. ∗∗∗p = 0.0003, ∗∗∗∗p < 0.0001. (G) Wild-type zebrafish were either left uninjected or were injected at the one-cell stage with either ptch1 gRNAs #1 and #2 or ptch1 gRNA #1 alone, and analyzed for survival following injection. The arrowhead on the x axis indicates the beginning of survival analysis. The total number of animals per group is indicated on the right. Data are plotted from a single experiment, and experiments were repeated twice. Statistical significance was calculated using the Mantel-Cox test. ∗∗∗∗p < 0.0001. See also Figure S1 and Table S1. |