
Fig. 4
- ID
- ZDB-FIG-240903-174
- Publication
- Casey et al., 2024 - A simple and scalable zebrafish model of Sonic hedgehog medulloblastoma
- Other Figures
- All Figure Page
- Back to All Figure Page
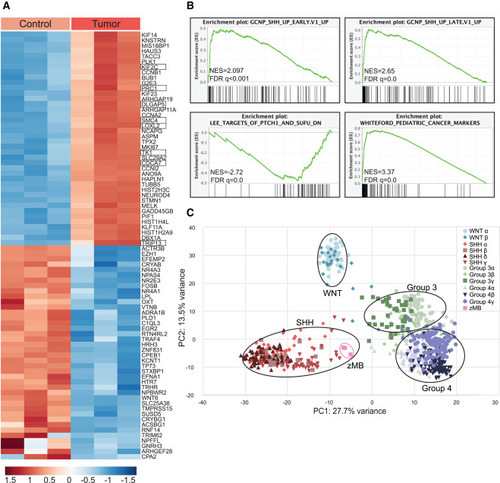
Zebrafish ptch1-crispant brain tumors resemble human SHH medulloblastoma (A) Heatmap of the top 40 differentially regulated genes in tp53M214K control brain tissue (Control) and tp53M214K; ptch1 gRNA #1 brain-tumor tissue (Tumor). Three biological replicates were analyzed per group. Control animals were 52 wpf, and tumor animals were 4–7 wpf. Genes were filtered for those that had clear human homologs. SHH-pathway response genes are boxed.40 (B) GSEA was performed to identify expression pathways enriched in tp53M214K; ptch1-crispant brain-tumor tissue compared to tp53M214K control brain. NES, normalized enrichment score; FDR, false discovery rate. (C) Principal-component analysis (PCA) comparing zebrafish tp53M214K; ptch1-crispant brain tumors with human MB samples that previously defined four major MB subgroups: SHH, WNT, group 3, and group 4. The zebrafish tumors (pink boxes) cluster with the human SHH subgroup, as indicated. See also Figures S2–S5 and Table S2. |