- Title
-
Inhibition of mitochondrial citrate shuttle alleviates metabolic syndromes induced by high-fat diet
- Authors
- Wang, J.X., Zhang, Y.Y., Qian, Y.C., Qian, Y.F., Jin, A.H., Wang, M., Luo, Y., Qiao, F., Zhang, M.L., Chen, L.Q., Du, Z.Y.
- Source
- Full text @ Am. J. Physiol. Cell Physiol.
|
Structure and expression distribution of fish Slc25a1 is similar to that of mammals. A: protein three-dimensional (3-D) structure of SLC25A1s. B: evolutionary tree of SLC25A1s. C: multiple sequence comparison of SLC25A1S. D and E: zebrafish slc25a1a and slc25a1b mRNA expression in several tissues (n = 4–6). |
|
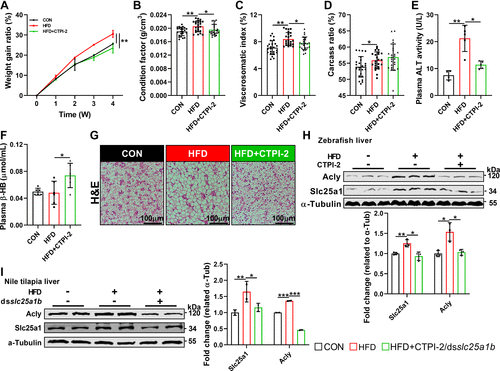
Blocking mitochondrial citrate export attenuates high-fat diet (HFD)-induced obesity. A: weight gain ratio (n = 3). B: condition factor (n = 24). C: viscerosomatic index (n = 24). D: carcass ratio (n = 24). E: plasma alanine aminotransferase (ALT) activity (n = 4–6). F: plasma β-HB content (n = 6). G: hepatic hematoxylin and eosin (H&E) section. H and I: protein expression of hepatic Slc25a1 and ACLY in zebrafish and Nile tilapia (n = 2–3). Values are means ± SD. The asterisk symbol indicates significant differences from the control treatment at *P < 0.05, **P < 0.01, ***P < 0.001 (independent-sample t test). |
|
Slc25a1 inhibition attenuates high-fat diet (HFD)-induced hyperglycemia by increasing glucose uptake but not use. A: plasma glucose levels (n = 5–6). B: plasma insulin levels (n = 6). C: glucose tolerance test of zebrafish (n = 5–6). D: mRNA expression of hepatic chrebp, glut2, and insrb in zebrafish (n = 5–7). E: hepatic glycogen in zebrafish (n = 6). F: hepatic glycolysis-related metabolites in zebrafish, n = 4. G: mRNA expression of hepatic pfk and pk in zebrafish (n = 5–7). H: mRNA expression of hepatic ldha, ldhba, and ldhbb in zebrafish (n = 5–7). I: mRNA expression of hepatic pca and pcb in zebrafish (n = 5–7). J and K: protein expression of hepatic Pdk4 and p-Pdhe1α in zebrafish and Nile tilapia (n = 2–3). L: rate of d-[1-14C]-glucose oxidation in primary hepatocytes of Nile tilapia (n = 3). M: glucose metabolism patterns after inhibition of Slc25a1 under HFD. Values are means ± SD. The asterisk symbol indicates significant differences from the control treatment at *P < 0.05, **P < 0.01, ***P < 0.001 (independent-sample t test). Figure created with BioRender.com. |
|
Slc25a1 inhibition attenuates high-fat diet (HFD)-induced abnormal hepatic lipid deposition by enhancing oxidative catabolism. A: hepatic triglyceride(TAG) content in zebrafish (n = 6). B: hepatic nonesterified fatty acid (NEFA) content in zebrafish (n = 6). C–F: mRNA expression of hepatic liposynthesis- and lipid catabolism-related genes in zebrafish (n = 5–7). G and I: protein expression of hepatic carnitine palmitoyltransferase 1a (Cpt1a) in zebrafish and Nile tilapia (n = 2–3). H: hepatic TAG content in Nile tilapia (n = 6). J and K: rate of [1-14C]- palmitic acid (PA) oxidation in vitro and in vivo (n = 3 and 6, respectively). L: lipid metabolism patterns after inhibition of Slc25a1 under HFD. Values are means ± SD. The asterisk symbol indicates significant differences from the control treatment at *P < 0.05, **P < 0.01, ***P < 0.001 (independent-sample t test). Figure created with BioRender.com. |
|
Slc25a1 inhibition enhances mitochondrial oxidative phosphorylation and proliferation in a high-fat diet (HFD). A and B: hepatic TCA cycle and oxidative phosphorylation-related gene expression and metabolites in zebrafish (n = 4 and 5–7, respectively). C: hepatic mtDNA in zebrafish (n = 6). D: mRNA expression of hepatic pgc1αa and pgc1αb in zebrafish (n = 5–7). E: mitochondrial metabolic patterns after inhibition of Slc25a1 under HFD. Values are means ± SD. The asterisk symbol indicates significant differences from the control treatment at *P < 0.05, **P < 0.01, ***P < 0.001 (independent-sample t test). Figure created with BioRender.com. |
|
Inhibition of Slc25a1 remodels protein acetylation modification in zebrafish liver under high-fat diet (HFD). A: hepatic acetyl-CoA content in zebrafish (n = 6). B: mRNA expression of hepatic sirts in zebrafish (n = 5–7). C: protein expression of hepatic Acss2 in zebrafish (n = 3). D and E: levels of pan-acetylation in zebrafish liver cell line (ZFL) and zebrafish liver. F: protein expression of hepatic ac-Cpa1a and ac-Pdhe1α in zebrafish (n = 2). G: hepatic acetyl-CoA content in Nile tilapia (n = 6). H: protein expression of hepatic ac-Cpa1a and ac-Pdhe1α in Nile tilapia (n = 2). I: the shift in acetylation paradigms after inhibition of Slc25a1 under HFD. Values are means ± SD. The asterisk symbol indicates significant differences from the control treatment at *P < 0.05, **P < 0.01, ***P < 0.001 (independent-sample t test). Figure created with BioRender.com. |


