
|
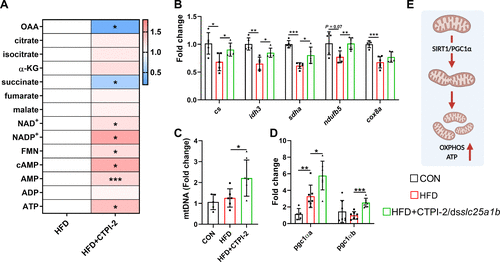
Fig. 5 Slc25a1 inhibition enhances mitochondrial oxidative phosphorylation and proliferation in a high-fat diet (HFD). A and B: hepatic TCA cycle and oxidative phosphorylation-related gene expression and metabolites in zebrafish (n = 4 and 5–7, respectively). C: hepatic mtDNA in zebrafish (n = 6). D: mRNA expression of hepatic pgc1αa and pgc1αb in zebrafish (n = 5–7). E: mitochondrial metabolic patterns after inhibition of Slc25a1 under HFD. Values are means ± SD. The asterisk symbol indicates significant differences from the control treatment at *P < 0.05, **P < 0.01, ***P < 0.001 (independent-sample t test). Figure created with BioRender.com.