FIGURE SUMMARY
Title

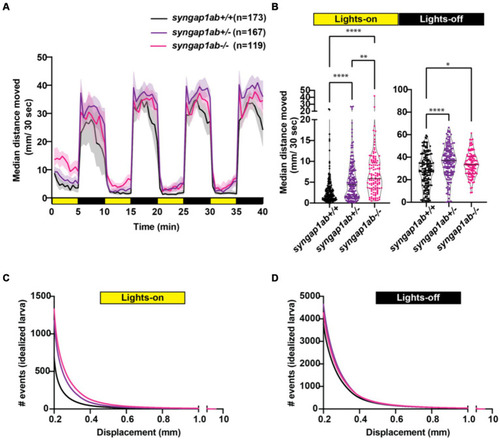
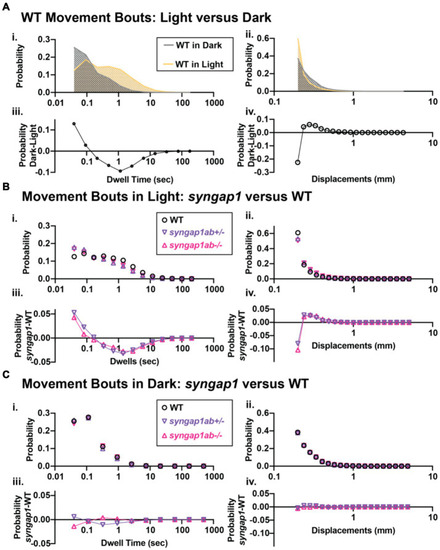
Context-dependent hyperactivity in syngap1a and syngap1b zebrafish models of SYNGAP1-related disorder

Authors
Sumathipala, S.H., Khan, S., Kozol, R.A., Araki, Y., Syed, S., Huganir, R.L., Dallman, J.E.
Source
Full text @ Front. Mol. Neurosci.

Zebrafish syngap1a and syngap1b isoforms. NCBI database searches revealed (A) five syngap1a (X1–X5) and (B) eleven syngap1b isoforms (X0, X2–5, X7–11, and X13) with evidence of expression. Transcriptional start sites are shown with arrows and stop codons are shown using an asterisk (*). Alternative splice sites are shown either using a dot (if the exon is missing <10 bp) or a box (if the difference is >10 bp). Isoform X*, box and connecting line colors denote exons and stop codons that are unique to the different isoforms. Black boxes and lines represent common exons/transcription start sites. The insert below the syngap1b X5 shows ten of eleven C-term amino acids (underlined) are identical to the human α1 isoform, with the PDZ-interacting domain shown in red.

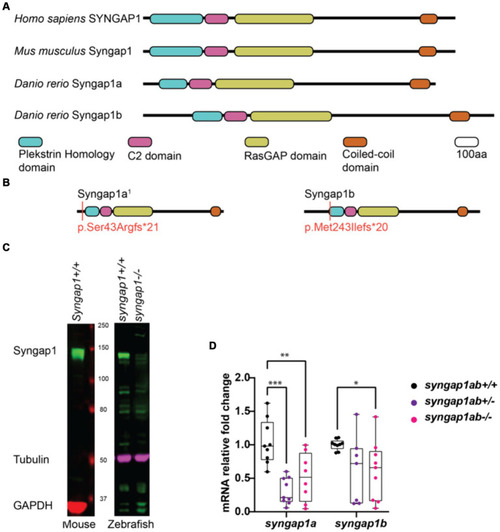
Zebrafish loss-of-function model for human SYNGAP1-RD. (A) Mammalian SYNGAP1 protein (H. sapiens and M. musculus) has four main protein interacting domains; pleckstrin homology (PH) domain, C2 domain, RasGAP domain, and coiled-coiled (CC) domain. Zebrafish (D. rerio) Syngap1 orthologs; Syngap1a and Syngap1b show domain conservation with that of mammals. (B) Syngap1ab protein diagrams show sites of CRISPR induced mutations. Resulting CRISPR mutants used for phenotypic analyses: syngap1a1 allele p.Ser43Argfs*21 and syngap1b allele p.Met149Ilefs*9. syngap1a1 had an amino acid change from a serine to an arginine at position 43 introducing a premature stop codon, 21 amino acids downstream. Syngap1b mutant allele had a change of methionine to an isoleucine at position 49 introducing a premature stop codon 9 amino acids downstream. (C) Western blots illustrate the expression of SYNGAP1 in whole brain lysates from adult mice and zebrafish. In wild-type zebrafish, the Syngap1 protein was detected at a similar molecular weight (~150 kDa) to that of the mouse SYNGAP1, using a rat anti-Syngap1 antibody. GAPDH and tubulin were used as the loading controls for mouse and zebrafish, respectively. (D) Mutant syngap1ab larvae showed reduced syngap1a and syngap1b mRNA expression levels at 7dpf. Group comparisons were made using 2-way ANOVA followed by Tukey’s multiple comparison test. p value asterisks represent: *p < 0.05, **p < 0.01; ***p < 0.001; ****p < 0.0001.

Syngap1ab larvae show short-term habituation to vibrational stimuli and more movement in response to stronger stimuli. (A) A schematic representation of the habituation assay (modified from Wolman et al., 2015) is shown. (B) Mean ± standard error movement velocity of WT and syngap1ab+/− larvae 1 s post-vibration. (C) Habituation indices were calculated per larva by subtracting the mean velocity post-habituation (taps 41–50) from the mean velocity pre-habituation (taps 11–20). (D) The median velocity mm/s moved per phase is shown for WT and syngap1ab+/− larvae. (E) Percentage response per phase is shown for WT and syngap1ab+/− larvae. A mixed effects model of genotype and phase was conducted and when p < 0.05 was followed by a Tukey’s multiple comparison test. *p < 0.05; **p < 0.01; ***p < 0.001; ****p < 0.0001.

Syngap1 model hyperactivity is most pronounced during light cycles due to a higher frequency of larger movements. (A) Median ± 95% confidence interval distance moved by each 6 dpf larva per 30 s, when exposed to 5 min of lights-on and 5 min of lights-off alternating cycles across five different independent trials (Supplementary Figure S3). (B) During lights-on cycles, syngap1ab mutants showed increased activity levels in a genotype dependent manner where syngap1ab−/− were more active than syngap1ab+/− which were more active than the WT larvae. During lights-off cycles, syngap1ab mutant larvae showed significantly increased activity compared to WT larvae but there were no significant differences in the activity levels between syngap1ab−/− and syngap1ab+/− larvae. Statistical analyses between genotypes were carried out using Kruskal-Wallis test followed by Dunn’s multiple comparison test. p value asterisks represent: *p < 0.05; **p < 0.01; ***p < 0.001; ****p < 0.0001. Displacement distribution of “idealized larva” during lights-on (C) and lights-off (D) conditions. Graphs were generated by pooling all displacement events during lights-on WT n = 119,135, syngap1ab+/− n = 196,594, and syngap1ab−/− n = 158,443 and during lights-off WT n = 652,368, syngap1ab+/− n = 777,525, and syngap1ab−/− n = 507,720 and then dividing these by the number of larvae: 173 WT, 167 syngap1ab+/−, and 119 syngap1ab−/−.

Syngap1ab mutants showed heightened arousal during lights-on cycles with more frequent and larger displacements. (Ai,ii) Probability distributions of dwell times (Ai) and displacements (Aii) are plotted for all 173 WT(syngap1ab+/+) larvae during lights-on (yellow) and lights-off (dark; checkered) cycles. Below (Aiii,iv) compare movements in dark and light by plotting probability in dark minus the probability in light. WT larvae moved farther more frequently in dark than in light. (B,C) Probability distributions of dwell time (Bi, Ci) and displacements (Bii, Cii) are plotted for all 173 WT, 167 syngap1ab+/− and 119 syngap1ab+/− mutant larvae. Below probability distribution plots (Biii,iv, Ciii,iv) compare movements in syngap1ab+/− (purple) and syngap1ab−/− (pink) to WT (black) by plotting probability in syngap1ab mutants minus the probability in WT. In dark, syngpa1ab+/− larvae moved more frequently than either WT or syngap1ab−/− larvae while all genotypes had similar displacement distributions. By contrast, in light, both syngpa1ab+/− and syngap1ab−/− larvae moved more frequently and farther than WT following a similar pattern that WT larvae showed during dark periods. p values were calculated using two-sample Kolmogorov–Smirnov test and for lights-on displacement: p(WT vs. syngap1ab+/−) = 0, p(WT vs. syngap1ab−/−) = 0, and p(syngap1ab+/− vs. syngap1ab−/−) = p < 10−70 and during lights-off displacement; p(WT vs. syngap1ab+/−) = 10−26, p(WT vs. syngap1ab−/−) = 1.5×10⁻¹¹, and p(syngap1ab+/− vs. syngap1ab−/−) = p < 10−45, lights-on dwell time (WT vs. syngap1ab+/−) = 0, p(WT vs. syngap1ab−/−) = 0, and p(syngap1ab+/− vs. syngap1ab−/−) = p < 10−31 and lights-off dwell time; p(WT vs. syngap1ab+/−) = 10−200, p(WT vs. syngap1ab−/−) = 10−50, and p(syngap1ab+/− vs. syngap1ab−/−) = p < 10−200.

Acknowledgments
This image is the copyrighted work of the attributed author or publisher, and ZFIN has permission only to display this image to its users. Additional permissions should be obtained from the applicable author or publisher of the image. Full text @ Front. Mol. Neurosci.