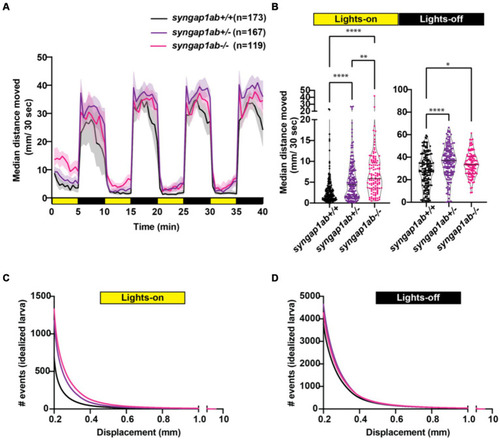
Syngap1 model hyperactivity is most pronounced during light cycles due to a higher frequency of larger movements. (A) Median ± 95% confidence interval distance moved by each 6 dpf larva per 30 s, when exposed to 5 min of lights-on and 5 min of lights-off alternating cycles across five different independent trials (Supplementary Figure S3). (B) During lights-on cycles, syngap1ab mutants showed increased activity levels in a genotype dependent manner where syngap1ab−/− were more active than syngap1ab+/− which were more active than the WT larvae. During lights-off cycles, syngap1ab mutant larvae showed significantly increased activity compared to WT larvae but there were no significant differences in the activity levels between syngap1ab−/− and syngap1ab+/− larvae. Statistical analyses between genotypes were carried out using Kruskal-Wallis test followed by Dunn’s multiple comparison test. p value asterisks represent: *p < 0.05; **p < 0.01; ***p < 0.001; ****p < 0.0001. Displacement distribution of “idealized larva” during lights-on (C) and lights-off (D) conditions. Graphs were generated by pooling all displacement events during lights-on WT n = 119,135, syngap1ab+/− n = 196,594, and syngap1ab−/− n = 158,443 and during lights-off WT n = 652,368, syngap1ab+/− n = 777,525, and syngap1ab−/− n = 507,720 and then dividing these by the number of larvae: 173 WT, 167 syngap1ab+/−, and 119 syngap1ab−/−.
|
